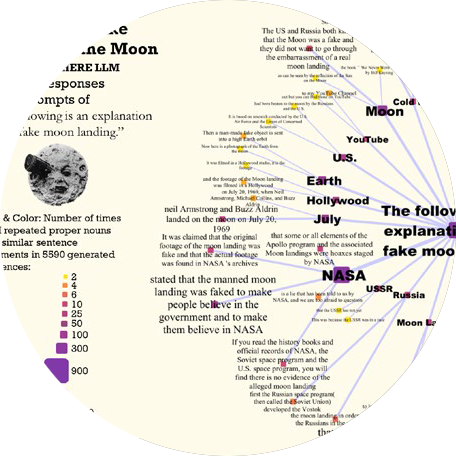
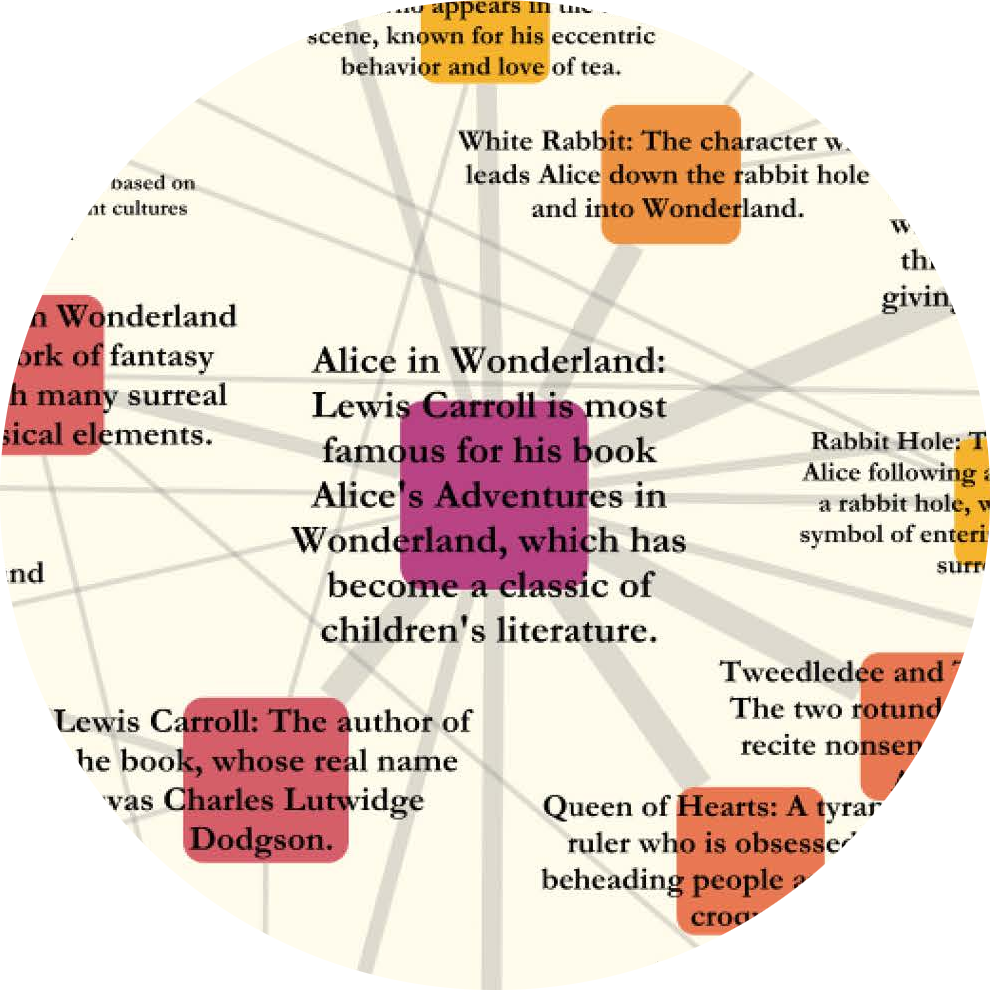
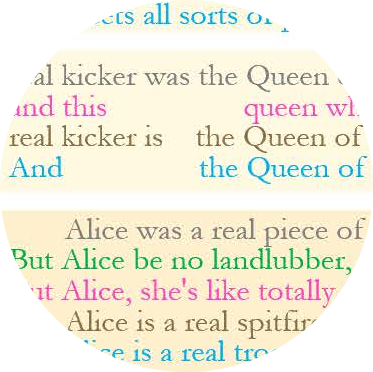
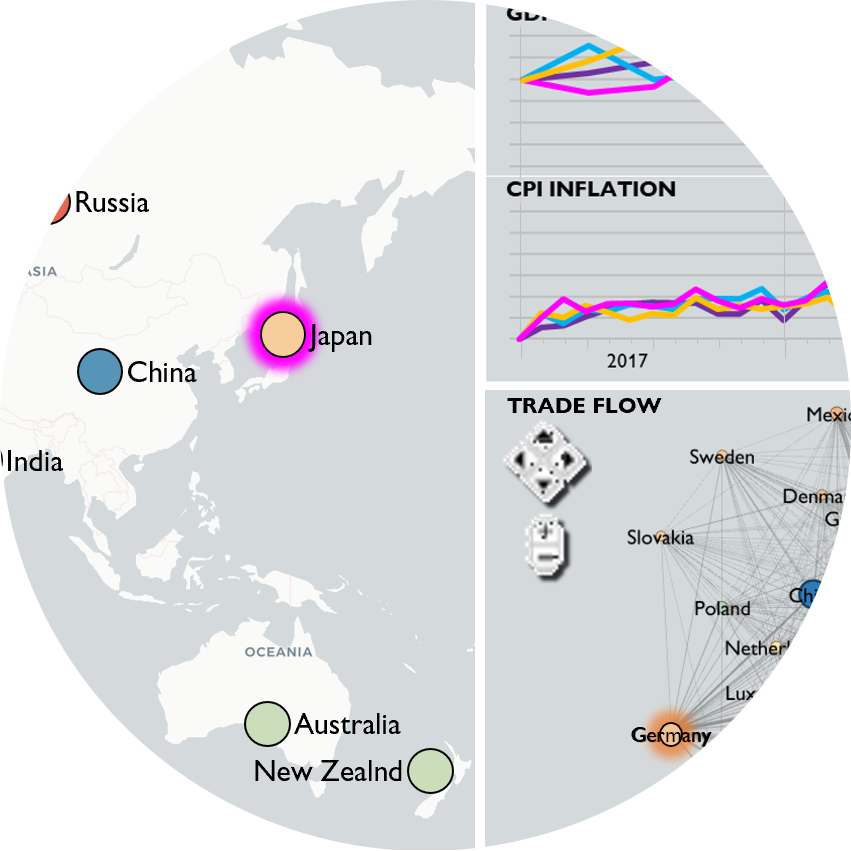
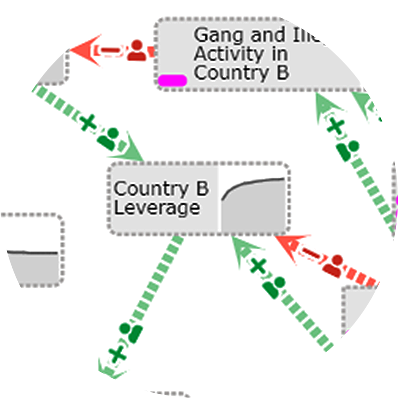
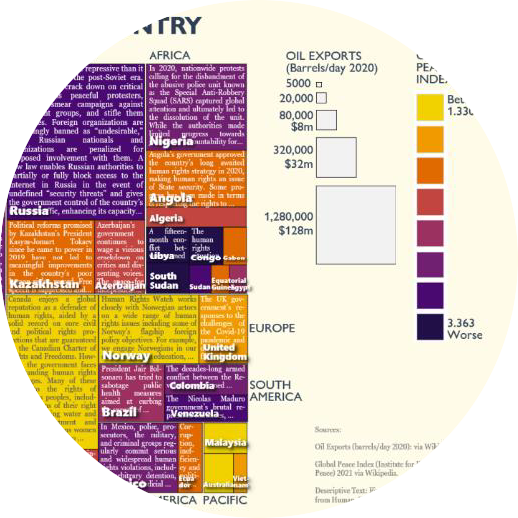
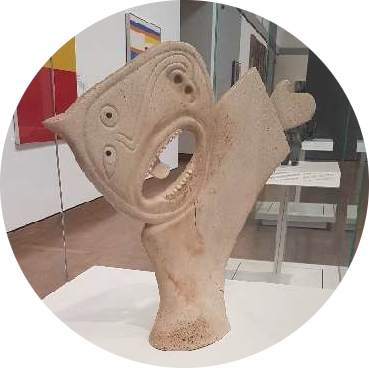
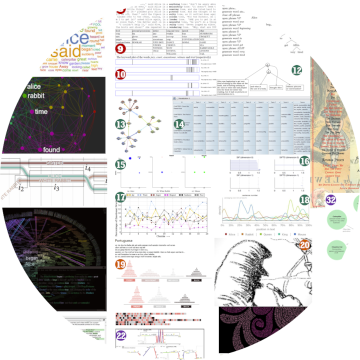
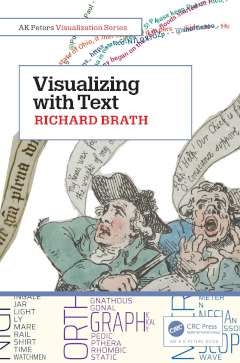
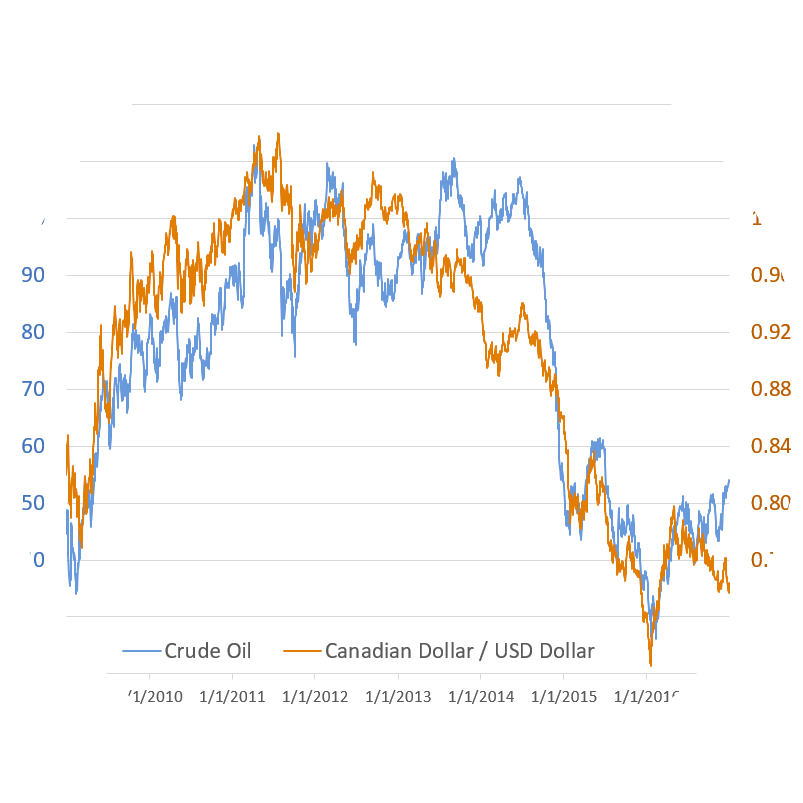
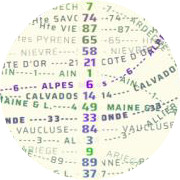
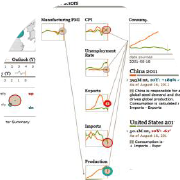
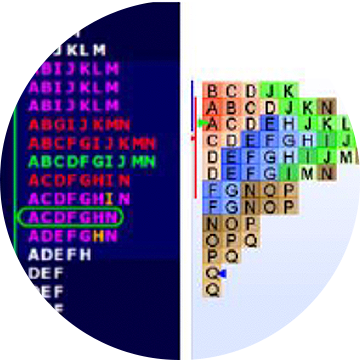
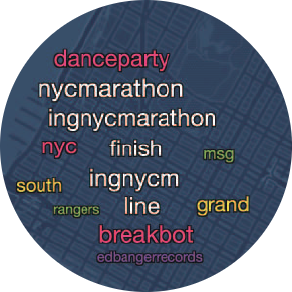
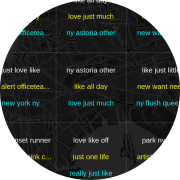
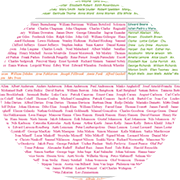
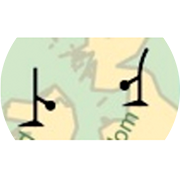
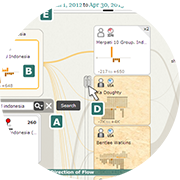
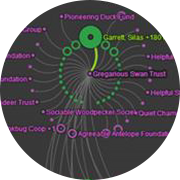
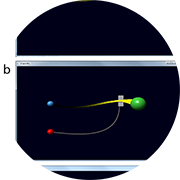
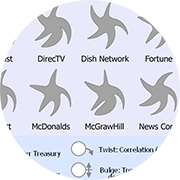
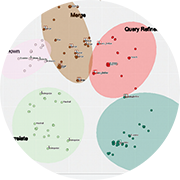
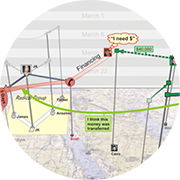
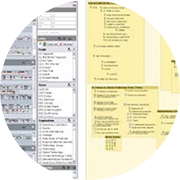
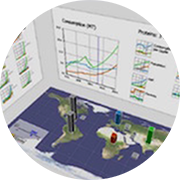
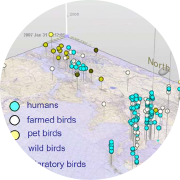
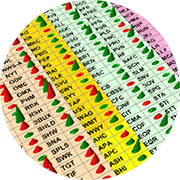
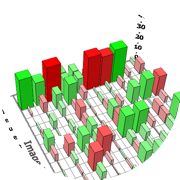
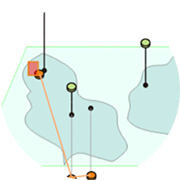
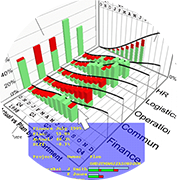
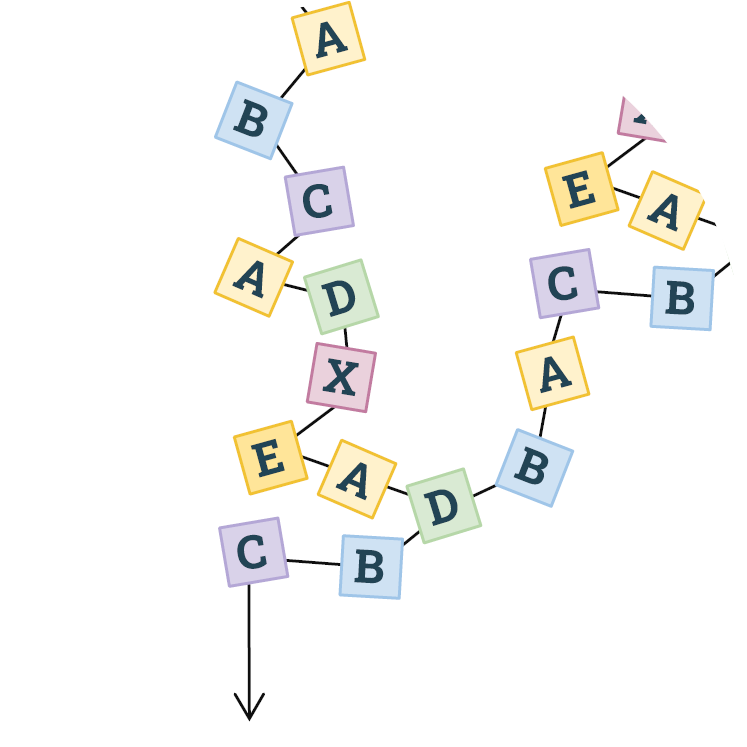
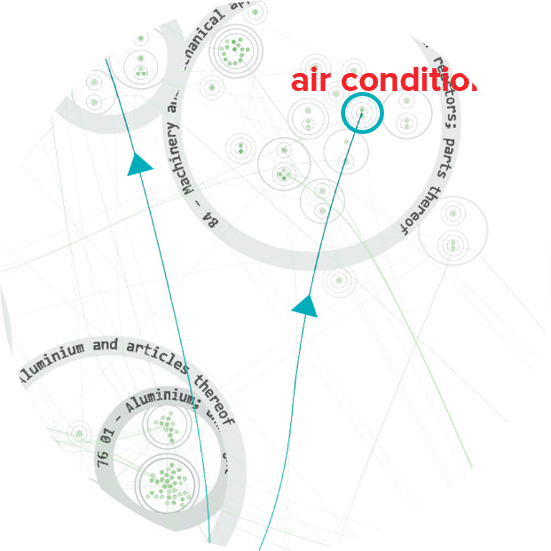
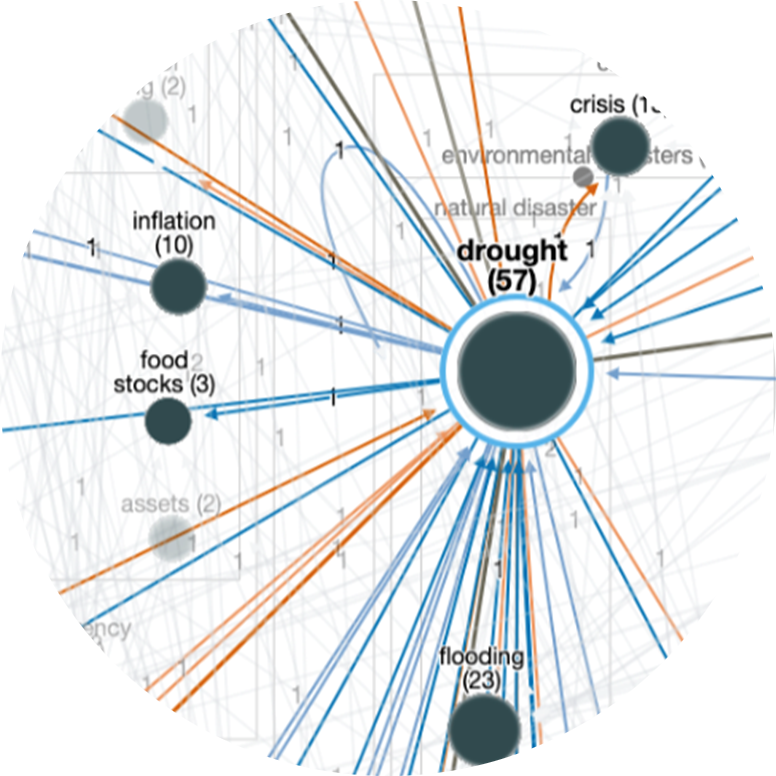
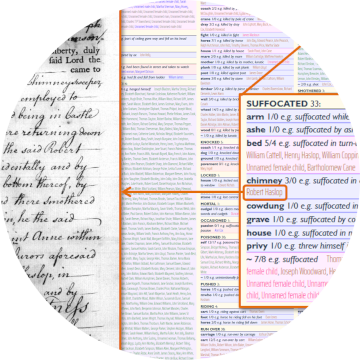
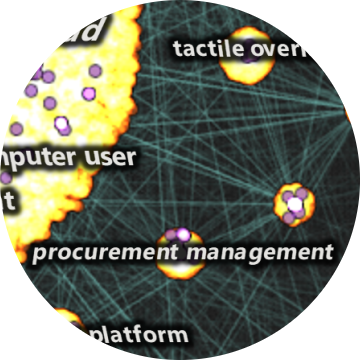
In an age of Large Language Models, online misinformation, plagiarism, hate speech, and more—the analysis of text is increasingly important. But traditional statistical visualization tools have lagged behind. Visualizing with Text characterizes the design-space for directly integrating and visualization to reveal information disparity with examples such as text-centric scatterplots, line charts, treemaps, mindmaps and tables.
Research
Working at the leading edge of technical innovation means knowing and contributing to the state of the art. Browse Uncharted's peer-reviewed scientific and technical papers below or use the filters to narrow your search.

2024
-
-
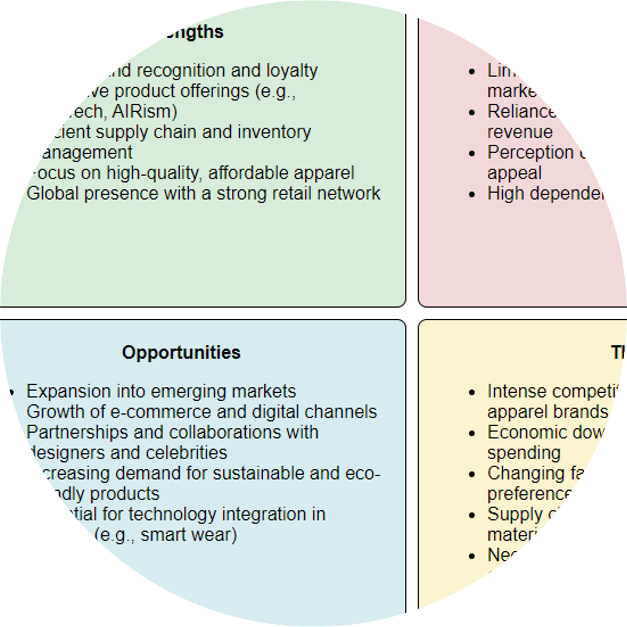
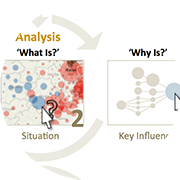
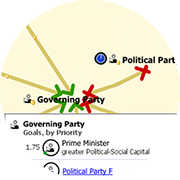
Strategy management analyses are created by business consultants with common analysis frameworks (i.e. comparative analyses) and associated diagrams. We show these can be largely constructed using LLMs, starting with the extraction of insights from data, organization of those insights according to a strategy management framework, and then depiction in the typical strategy management diagram for that framework (static textual visualizations).
-
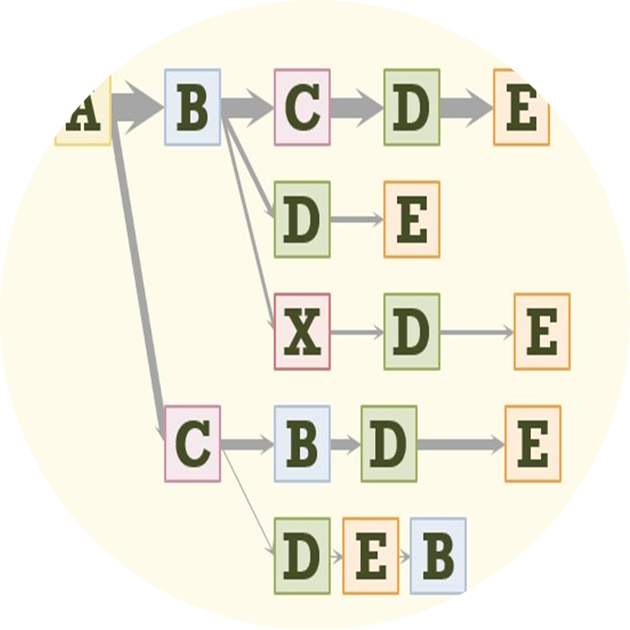
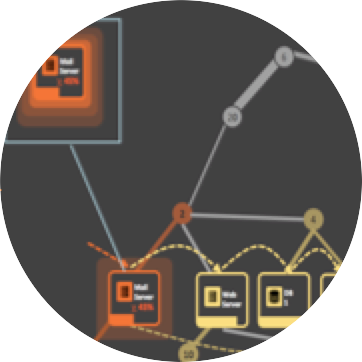
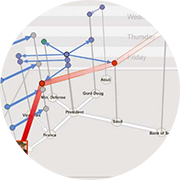
Process mining and more broadly journey analytics create sequences that can be understood with graph-oriented visual analytics. We have designed and implemented more than a dozen visual analytics on sequence data in production software over the last 20 years. We outline a variety of data challenges, user tasks, visualization layouts, node and edge representations, and interactions, including strengths and weaknesses and potential future research.
-
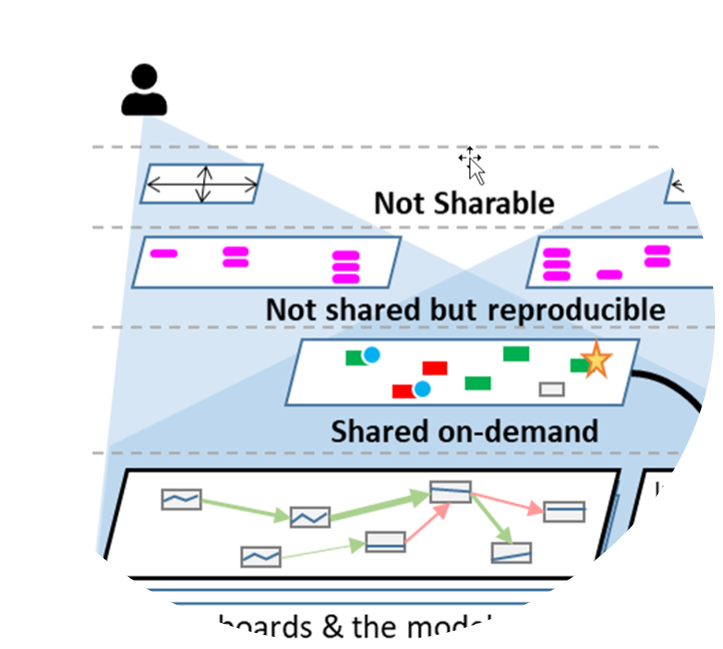
In the evolving field of scientific modeling research, computational notebooks have made steps to promote collaboration by providing interactive environments for code execution, visualization, and narrative composition; however they are still limited. To overcome these limitations, we introduce Terarium, a platform that attempts to socialize scientific modeling for a broad audience, including students, researchers, and data scientists.
2023
-
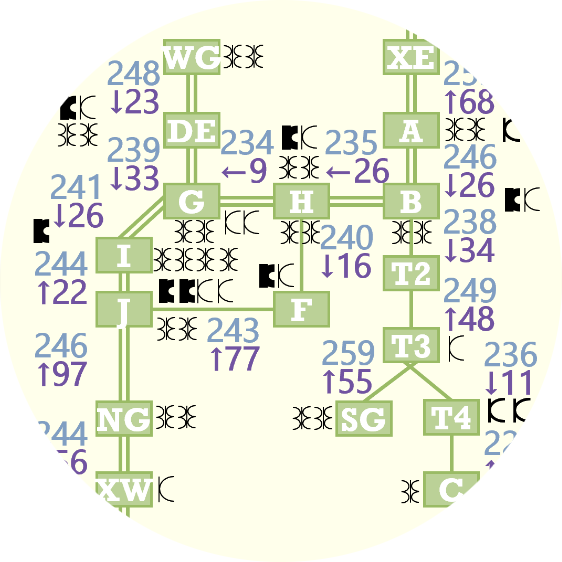
Electric networks are globally significant systems being transformed to support increased wind and solar generation. To structure development of real-time operator support, we developed a conceptual model of electric transmission network operation that represents physical, functional, and purposeful distinctions and summaries used by experts at a North American transmission operator and reliability coordinator.
-
The breadth and depth of knowledge learned by Large Language Models (LLMs) can be assessed through repetitive prompting and visual analysis of commonality across the responses. We show levels of LLM verbatim completions of prompt text through aligned responses, mind-maps of knowledge across several areas in general topics, and an association graph of topics generated directly from recursive prompting of the LLM.
-
Text Style Transfer (TST) retains semantic content while modifying stylistic features. Exploratory visualization of LLM-generated TST via semantically aligned text visualization reveals advanced stylistic techniques such as use of metaphors. LLM style inquiry can be used to articulate advanced stylistic devices such as interjections, idioms and rhetorical devices and visually depicted as multivariate style heatmaps.
-
For effective visualizations, there are many types of design to consider. Visualization design focuses on core theory of tasks, data and visual encodings. Workflow design, user interface design and graphic design all contribute to successful visualizations. All design aspects range from initial design exploration to iterative design refinement. Guidelines can help, but have limitations.
2022
-
The construction of computational causal models for complex systems has typically been completed manually by domain experts and is a time-consuming, cumbersome process. We introduce Causeworks, an application in which operators “sketch” complex systems, leverage AI tools and expert knowledge to transform the sketches into computational causal models, and then apply analytics to understand how to influence the system.
-
Qualitative data can be conveyed with strings of text. Fitting longer text into visualizations requires a) space to place the text inside the visualization; and b) appropriate text to fit the space available. To fit text within these layouts is a function for emerging NLP capabilities such as summarization.
-
Gaps and requirements for multi-modal interfaces for humanities can be explored by observing the configuration of real-world environments and the tasks of visitors within them compared to digital environments. Some of these capabilities exist, but not routinely available in implementations.
-
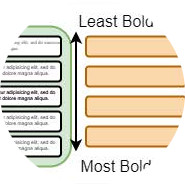
Text is one of the most commonly used ways to transmit information. It is widely used in various visualizations and determines our understanding of the presented content. The information density of text can be enhanced by visualizing data in typographic attributes, such as font weight, letter spacing, or oblique angle. To increase information density the furthest, without the visualization losing performance or effectiveness, the perceivable granularity of the typographic attributes needs to be known.
-
Visual Analytics of Hierarchical and Network Timeseries Models
Dual Y Axes Charts Defended: Case Studies, Domain Analysis and a Method
VisIRML: Visualization with an Interactive Information Retrieval and Machine Learning Classifier
Uncharted contributed the following chapters to Integrating Artificial Intelligence and Visualization for Visual Knowledge Discovery:
Visual Analytics of Hierarchical and Network Timeseries Models: Visual analytics that represent many aspects of timeseries models in one holistic application are perceptually scalable to exploration of millions of nodes.
Dual Y Axes Charts Defended: Case Studies, Domain Analysis and a Method: We show dual axes charts are necessary for fine-grained correlation analysis that is not made obvious within single axis charts or other means.
VisIRML: Visualization with an Interactive Information Retrieval and Machine Learning Classifier: VisIRML, a system to classify and display unstructured data, produces higher quality labels than semi-supervised learning techniques.
-
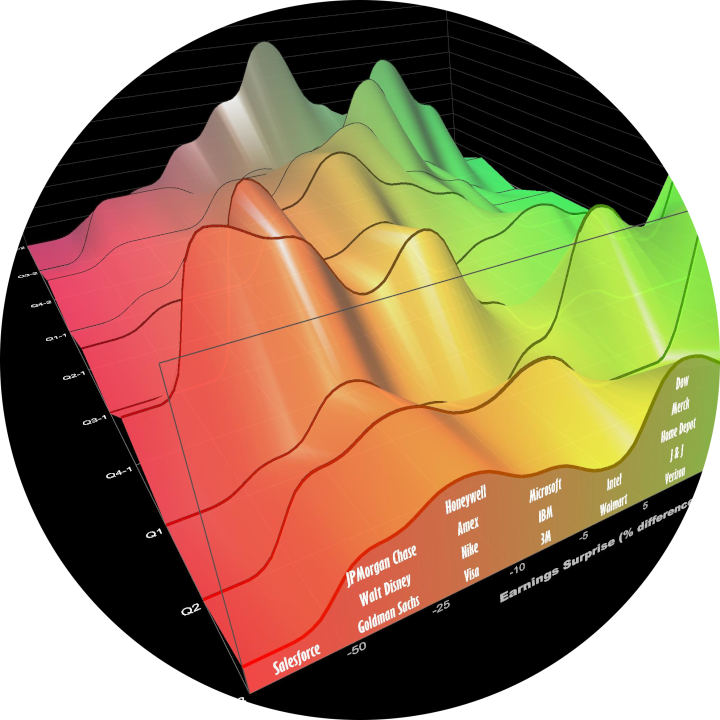
3D charts are not common in financial services. We review chart use in practice. We create 3D financial visualizations starting with 2D charts used extensively in financial services, then extend into the third dimension with timeseries data. We embed the 2D view into the 3D scene; constrain interaction and add depth cues to facilitate comprehension. Usage and extensions indicate success.
-
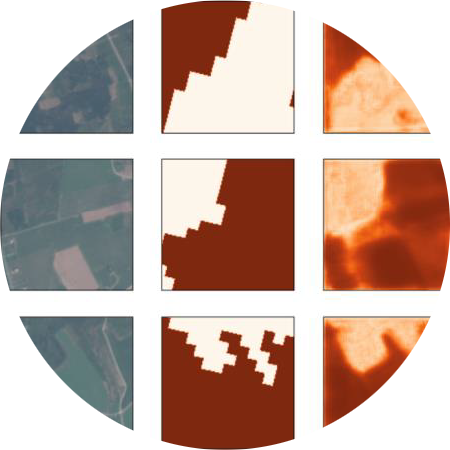
Distil is a system for constructing point-and-click machine learning models, here extended for multi-spectral satellite imagery for timeseries data leveraging an autoML pipeline, adding embedding model trained using self-supervised learning; rapid data labeling facilitated with image query; hierarchical geospatial timeseries modeling; and sub-image feature extraction using weakly supervised segmentation.
2021
-
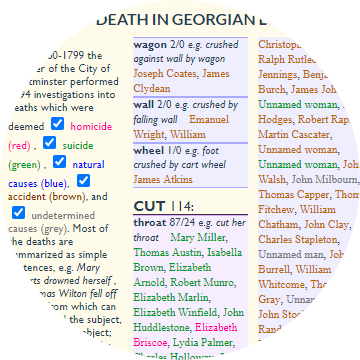
There are still many potential literature visualizations to be discovered. By focusing on a single text, the author surveys many existing visualizations across domains, in the wild, and creates new visualizations. Many dozen techniques are indicated, suggesting a wider variety of potential visualizations beyond research disciplines.
-
Modeling complex systems is a time-consuming, difficult and fragmented task, often requiring the analyst to work with disparate data, a variety of models, and expert knowledge across a diverse set of domains. Applying a user-centered design process, we developed a mixed-initiative visual analytics approach, a subset of the Causemos platform, that allows analysts to rapidly assemble qualitative causal models of complex socio-natural systems.
-
This paper describes an ongoing multi-scale visual analytics approach for exploring and analyzing biomedical knowledge at scale. We utilize global and local views, hierarchical and flow-based graph layouts, multi-faceted search, neighborhood recommendations, and document visualizations to help researchers interactively explore, query, and analyze biological graphs against the backdrop of biomedical knowledge.
-
One of the challenges when building Machine Learning (ML) models using satellite imagery is building sufficiently labeled data sets for training. In the past, this problem has been addressed by adapting computer vision approaches to GIS data with significant recent contributions to the field. But when trying to adapt these models to Sentinel-2 multi-spectral satellite imagery these approaches fall short. To address this deficit, we present Distil, and demonstrate a specific method using our system for training models with all available Sentinel-2 channels.
-
Biologists grapple with large multi-scale graphs to find relevant subgraphs for answering a range of biological questions. Our approach for scalable graph analysis enables biologists to interactively explore, query, and analyze biological graphs at different scales. Computational biologists see promise in our approach for various use cases such as drug interactions and disease propagation.
-
Quantitative data, such as a 10k financial report, requires cognitive load to scan the columns and rows and identify patterns and important takeaways, whether novice or subject matter expert. Visualizations can be used to summarize and reveal patterns. However, it may still be difficult to understand what is most meaningful. What should the viewer pay attention to? In this research, we reduce the cognitive load in understanding tabular data by combining charts with ranked natural language generated (NLG) bullet point statements that summarize the top takeaways.
-
The covert nature of sex trafficking provides a significant barrier to generating large-scale, data-driven insights to inform law enforcement, policy and social work. We leverage massive deep web data (collected globally from leading commercial sex websites) in tandem with a novel machine learning framework to unmask suspicious recruitment-to-sales pathways, thereby providing the first global network view of trafficking risk in commercial sex supply chains.
-
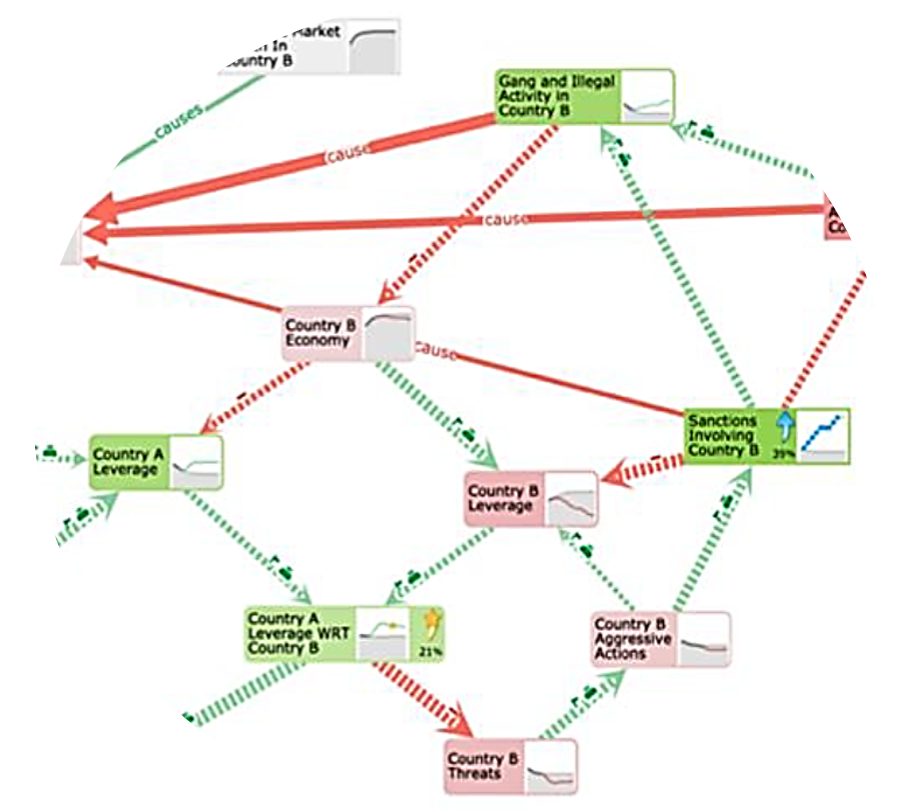
Military planners use “Operational Design” (OD) to understand systems and relationships in complex operational environments. Causeworks is a visual analytics application for OD teams to collaboratively build causal models of environments to understand and find solutions to affect them. Collaborative causal modeling can help teams craft better plans, but there are unique challenges in developing synchronous collaboration tools for building and using causal models. Causeworks overlays analytics inputs and outputs over a shared causal model to flexibly support multiple modeling tasks simultaneously in a collaborative environment with minimal state management burden on users.
-
Causal Model building for complex problems has typically been completed manually by domain experts and is currently a time-consuming, cumbersome process. The resulting models are simple diagrams produced on whiteboards, and do not support computational analytics, thus limiting usefulness. Causeworks helps operators “sketch” complex systems, and transforms sketches into computational causal models using automatic and semi-automatic causal model construction from knowledge extracted from unstructured and structured documents. Causeworks integrates computational analytics to assist users in understanding and influencing the system.
2020
-
Visualizing with Text uncovers the rich palette of text elements usable in visualizations from simple labels through to documents. Using a multidisciplinary research effort spanning across fields including visualization, typography, and cartography, it builds a solid foundation for the design space of text in visualization.
-
Digital humanities are rooted in text analysis. However, most visualization paradigms use only categoric, ordered or quantitative data. Literal text must be considered a base data type to encode into visualizations. Literal text offers functional, perceptual, cognitive, semantic and operational benefits. These are briefly illustrated with a subset of sample visualizations focused on semantic word sequences, indicating benefits over standard graphs, maps, treemaps, bar charts and narrative layouts.
-
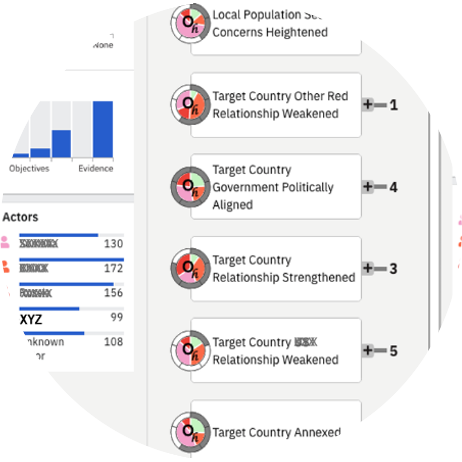
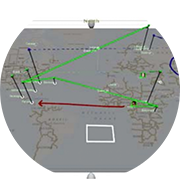
Strategy Mapper is a visual analytic tool for human-machine decision making in complex situations with uncertainty in estimating and understanding a competitor’s intent and tactics. Users can compare and reason through multiple hypotheses about one or more competitor’s behaviors, and consider recommendations to probe for more information. Using the “Gray Zone” as an application example, a user evaluation exercise shows the methods are usable and effective.
-
Many researchers and authors recommend against dual-axis charts. We provide a case study of timeseries correlation analysis in financial services where dual-axis charts superimpose series to facilitate observation of local patterns. Fine-grain patterns cannot be otherwise perceived using a single-axis charts, normalization charts, scatterplots nor statistical correlation analysis.
2019
-
To relate typical survey map features to the real world during navigation, users must make time-consuming, error-prone cognitive transformations in scale and rotation and make frequent realignments over time. In this paper, we introduce SkyMap, a novel immersive display device method that presents a world-scaled and world-aligned map above the user that evokes a huge mirror in the sky. This approach, which we have implemented in a VR-based testbed, potentially reduces cognitive effort associated with survey map use.
-
We present a system that combines ambient visualization, information retrieval and machine learning to facilitate the ease and quality of document classification by subject matter experts for the purpose of organizing documents by “tags” inferred by the resultant classifiers. This system includes data collection, a language model, query exploration, feature selection, semi-supervised machine learning and a visual analytic workflow enabling non-data scientists to rapidly define, verify, and refine high-quality document classifiers.
-
Timeseries models are used extensively in financial services, for example, to quantify risk and predict economics. However, analysts also need to comprehend the structure and behavior of these models to better understand and explain results. We present a methodology, derived from extensive industry experience, to aid explanation through integrated interactive visualizations that reveal model structure and behavior of constituent timeseries factors, thereby increasing understanding of the model, the domain and the sensitivities. Expert feedback indicates alignment with mental models.
-
SparkWords are consistently sized words embedded in prose, lists or tables; enhanced with additional data including (a) categoric, ordered or quantitative data; (b) encoded by a variety of attributes (singular or multiple); and (c) applied to words or letters. Historic examples and sample implementations show a range of novel techniques and different uses.
2018
-
Typographic variables were only briefly discussed by Bertin with no example applications. We extend Bertin’s framework with literal encoding, ten typographic attributes, variations on scope including characters, words, phrases and paragraphs, and more layout types. We apply the framework to Bertin’s population dataset to create eleven new typographic visualizations. New research opportunities include readability, semantic association, interaction, and comprehension.
-
Annotations on typical charts, graphs and maps draw a viewer’s attention to a particular subset of an otherwise information-dense display thereby aiding understanding. Instead of manual creation of annotations, we outline approaches to automatically generate annotations.
-
We present in-progress work on Distil, a mixed-initiative system to enable non-experts with subject matter expertise to generate data-driven models using an interactive analytic question first workflow. Our approach incorporates data discovery, enrichment, analytic model recommendation, and automated visualization to understand data and models.
-
This paper describes an abstractive summarization method for tabular data which employs a knowledge base semantic embedding to generate the summary. Assuming the dataset contains descriptive text in headers, columns and/or some augmenting metadata, the system employs the embedding to recommend a subject/type for each text segment. Recommendations are aggregated into a small collection of super types considered to be descriptive of the dataset by exploiting the hierarchy of types in a prespecified ontology.
-
Detecting anomalous events of a particular area in a timely manner is an important task. Geo-tagged social media data are useful resources, but the abundance of everyday language in them makes this task still challenging. To address such challenges, we present TopicOnTiles, a visual analytics system that can reveal the information relevant to anomalous events in a multi-level tile-based map interface by using social media data. To this end, we adopt and improve a recently proposed topic modeling method that can extract spatio-temporally exclusive topics corresponding to a particular region and a time point.
-
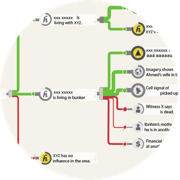
Causality is important for providing explanations when using computational models to understand complex systems structure and behavior, and what happens when change occurs in the system. There are many properties of causality that need to be considered and made visible, but current causality visualization methods are limited in expressions, scale, dimensionality and do not provide sufficient support for user tasks such as “what-if” and “how-to” questions, or in supporting groups considering multiple scenarios.
2017
-
Stem and leaf plots are data dense visualizations that organize large amounts of micro-level numeric data to form larger macro-level visual distributions. These plots can be extended with font attributes and different token lengths for new applications such as n-grams analysis, character attributes, set analysis and text repetition.
-
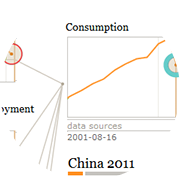
Timeseries line charts are a popular visualization technique but traditionally do not show many lines. We borrow concepts of tiny microtext and path dependent cartographic text to embed labels and additional text directly into lines on line charts, thereby making it easier to identify individual lines in a congested line chart, enabling more lines to be displayed and enabling additional data to be added to the lines as well.
-
We propose herein a novel topic modeling approach on text documents with spatio-temporal information (e.g., when and where a document was published) such as location-based social media data to discover prevalent topics or newly emerging events with respect to an area and a time point. We consider a map view composed of regular grids or tiles with each showing topic keywords from documents of the corresponding region. To this end, we present a tile-based spatio-temporally exclusive topic modeling approach called STExNMF, based on a novel nonnegative matrix factorization (NMF) technique.
-
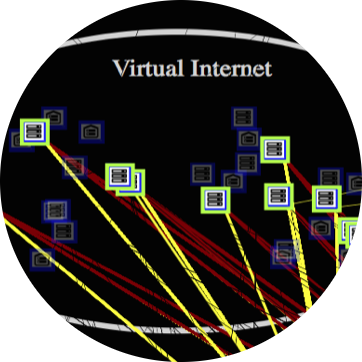
Decision support systems for network security represent a critical element in the safe operation of computer networks. Unfortunately, due to their complexity, it can be difficult to implement and empirically assess novel techniques for displaying networks. This paper details an open source adaptive user interface that hopes to fill this gap. This system supports agile development and offers a wide latitude for human factors and machine learning design modifications. The intent of this system is to serve as an experimental testbed for determining the efficacy of different human factors and machine learning initiatives on operator performance in network monitoring.
-
Argument Mapper provides an easy-to-use, theoretically sound, web-based interactive software tool that enables the application of evidence-based reasoning to analytic questions. Designed in collaboration with analytic methodologists, this tool combines structured argument mapping methodology with visualization techniques to help analysts make sense of complex problems and overcome cognitive biases.
-
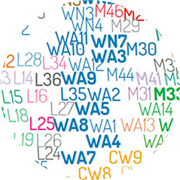
The rich history of cartography and typography indicates that typographic attributes, such as bold, italic and size, can be used to represent data in labels on thematic maps. These typographic attributes are itemized and characterized for encoding literal, categorical and quantitative data. Label-based thematic maps are shown, including examples that scale to multiple data attributes and a large number of entities.
2016
-
In this position paper, we extend design critiques as a form of evaluation to visualization, specifically focusing on unique qualities of critiques that are different than other types of evaluation by inspection, such as heuristic evaluation, models, reviews or written criticism. Critiques can be used to address a broader scope and context of issues than other inspection techniques; and utilize bi-direction dialogue with multiple critics, including non-visualization critics.
-
We present a visual analytics system that supports the geospatiotemporal analysis of social media data based on a large-scale distributed topic modeling technique. Through the analysis of social media data in a given time and region, we can identify critical events in real time. However, it takes significant time to perform such analyses against a large amount of social media data. As a way to handle this issue, we developed an efficient tile-based topic modeling approach, which divides textual data into multiple subsets with respect to different regions and time frames at different zoom levels and applies topic modeling to each subset.
-
We are investigating FocalPoint, an adaptive level of detail (LOD) recommender system tailored for hierarchical network information structures. FocalPoint reasons about contextual information associated with the network, user task, and user cognitive load to tune the presentation of network visualization displays to improve user performance in perception, comprehension and projection of current situational awareness. Our system is applied to two complex information constructs important to dynamic cyber network operations: network maps and attack graphs.
-
Our research focus is on developing FocalPoint, a system that provides Adaptive Level of Detail (LOD) in user interfaces for cybersecurity operations. FocalPoint is a recommender system tailored for complex network information structures that reasons about contextual information associated with the network, user tasks, and cognitive load. This facilitates tuning cyber visualization displays, thereby improving user performance in perception, comprehension and projection of current Cybersecurity Situational Awareness (Cyber SA).
-
We show that many different set visualization techniques can be extended with the addition of labeled elements using font attributes. Elements labeled with font attributes can: uniquely identify elements; encode membership in ten sets; use size to indicate proportions among set relations; can scale to thousands on clearly labeled elements; and use intuitive mappings to facilitate decoding.
-
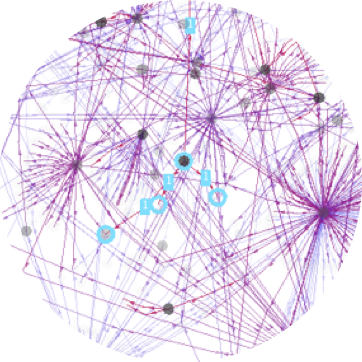
Graph visualizations increase the perception of entity relationships in a network. However, as graph size and density increases, readability rapidly diminishes. In this cover article for the July 2017 edition of the Information Visualization journal, we present an end-to-end, tile-based visual analytic approach called graph mapping that utilizes cluster computing to turn large-scale graph (node-link) data into interactive visualizations in modern web browsers.
-
This article is a systematic exploration and expansion of the data visualization design space focusing on the role of text. A critical analysis of text usage in data visualizations reveals gaps in existing frameworks and practice. A cross-disciplinary review including the fields of typography, cartography, and coding interfaces yields various typographic techniques to encode data into text, and provides scope for an expanded design space.
2015
-
Graph visualizations increase the perception of entity relationships in a network. However, as graph size and density increases, readability rapidly diminishes. In this paper, we present a tile-based visual analytic approach that leverages cluster computing to create large-scale, interactive graph visualizations in modern web browsers. Our approach is optimized for analyzing community structure and relationships.
-
In this paper, we present lessons learned in the development of TellFinder, a tool designed to explore domain-specific web crawls using graph analysis and multi-modal visualization. The initial application of the tool was to help combat human trafficking through entity resolution and characterization based on data from sex ads crawled from a variety of publicly available sites.
-
Encoding a high number of categories in a glyph may be necessary and can be encoded as label, icon, shape or texture. Number of categories, transparency, layout, compound glyph and legibility are considerations for the encoding.
-
In this paper, we present in-progress work on applications of tile-based visual analytics (TBVA) to population pattern of life analysis and geo-temporal event detection. TBVA uses multiresolution data tiling, analytics and layered high-fidelity visualization to enable interactive multi-scale analysis of billions of records in modern web browsers through techniques made familiar by online map services.
-
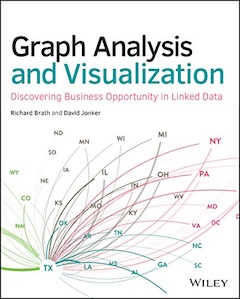
Graph Analysis and Visualization brings graph theory out of the lab and into the real world. Using sophisticated methods and tools that span analysis functions, this guide shows you how to exploit graph and network analytic techniques to enable the discovery of new business insights and opportunities.
2014
-
Financial visualization has existed for more than 100 years. Ongoing growth of financial markets increases the frequency, complexity and scale of data while users need to discern meaningful insights for many different types of tasks and objectives. This panel brings together four established practitioners from the financial industry who use visualization tools every day.
-
[Short Paper] Humans are vulnerable to cognitive biases such as neglect of probability, framing effect, confirmation bias, conservatism (belief revision) and anchoring. The Argument Mapper addresses these biases in intelligence analysis by providing an easy-to-use, theoretically sound, web-based interactive software tool that enables the application of evidence-based reasoning to analytic questions.
-
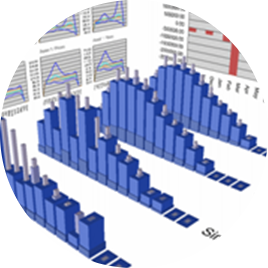
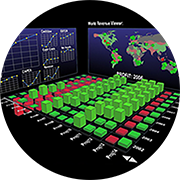
3D information visualization has existed for more than 100 years. 3D offers intrinsic attributes such as an extra dimension for encoding position and length, meshes and surfaces; lighting and separation. Further 3D can aid mental models for configuration of data within a 3D spatial framework. Perceived issues with 3D are solvable and successful, specialized information visualizations can be built.
-
Font specific attributes, such as bold, italic and case can be used in knowledge mapping and information retrieval to encode additional data in texts, lists and labels to increase data density of visualizations; encode data quantitative data into search lists; and facilitate text skimming and refinement by visually promoting of words of interest.
-
There are many different types of shape attributes that can be used to encode data for information visualizations. Prior art from many fields and experiments suggest that there are more than a half dozen different attributes of shape that can potentially be utilized to effectively represent categoric and quantitative data values.
-
In this paper, we present in-progress work on “Influent,” a graph analysis tool that enables an intelligence analyst to visually and interactively “follow the money” or other transaction flow. Summary visualizations of transactional patterns and entity characteristics, a left-to-right semantic flow layout, interactive link expansion and hierarchical entity clustering enable Influent to operate effectively at scale with millions of entities and hundreds of millions of transactions, with larger data sets in progress.
2013
-
The widespread use and adoption of web-based geo maps have provided a familiar set of interactions for exploring extremely large geo data spaces and can be applied to similarly large abstract data spaces. Building on these techniques, a tile based visual analytics system (TBVA) was developed that demonstrates interactive visualization for a one billion point Twitter dataset.
-
Visual aggregation techniques, tools and easily tailorable components are needed that will support answering analytical questions with data description, characterization and interaction without loss of information. We present two case studies of prototype implementations of JavaScript browser-based visualization tools leveraging the Louvain clustering algorithm.
-
Our goal is to develop new automated tools to produce effective raw data characterization on extremely large datasets. This paper reports on the development of a web based interactive scatter plot prototype that uses tile-based rendering similar to geographic maps and interaction paradigms.
-
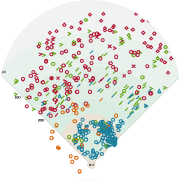
Visualization of big data in baseball at the per pitch level including measured data and video can be made effective for coaches and managers through a variety of information visualization techniques focused on creating easy to use and easy to understand visualizations.
-
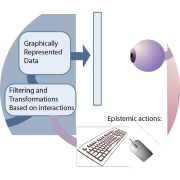
In this paper we introduce Visual Thinking Design Patterns (VTDPs) as part of a methodology for producing cognitively efficient designs. We describe their main components, including epistemic actions (actions to seek knowledge) and visual queries (pattern searches that provide a whole or partial solution to a problem). We summarize the set of 20 VTDPs we have identified so far and show how they can be used in a design methodology.
-
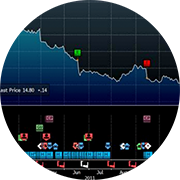
Bloomberg has designed and implemented a scalable visual representation for the depiction of many discrete timestamped events in use by hundreds of thousands of financial markets experts. This visualization enables a single screen to visually organize a large volume of event data; to facilitate inference through visual alignment of related data; and to provide a workflow from the single point of access to a wide variety of detailed information.
-
Aperture is an open, adaptable and extensible Web 2.0 visualization framework, designed to produce visualizations for analysts and decision makers in any common web browser. Aperture utilizes a novel layer based approach to visualization assembly, and a data mapping API that simplifies the process of adaptable transformation of data and analytic results into visual forms and properties.
2012
-
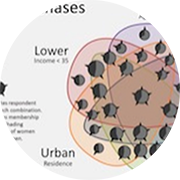
Representing quantities on Venn and Euler diagrams can be achieved through the use of multi-attribute glyphs. These glyphs can also act as an aid to assist in the visual decoding of the membership of segments within the diagrams and convey other data attributes as well.
-
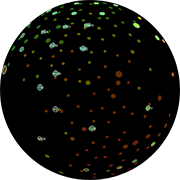
Use of a sphere as a basis for organizing an information visualization should balance issues such as occlusion against potential useful benefits such as natural navigational affordances and perceptual connotations of an application.
2011
-
nSpace2 is an innovative visual analytics tool that was the primary platform used to search, evaluate, and organize the data in the VAST 2011 Mini Challenge #3 dataset. nSpace2 is a web-based tool that is designed to facilitate the back-and-forth-flow of the multiple steps of an analysis workflow, including search, data triage, organization, sense-making, and reporting.
-
In this paper we report on our preliminary designs for Animated Attention Redirection Codes (AARCs), these are interactive short animated streaks traveling from a moused over symbol that convey information linkages in a transitory manner.
2010
-
A chapter from Estimating Impact: A Handbook of Computational Methods and Models for Anticipating Economic, Social, Political and Security Effects in International Interventions by Alexander Kott and Gary Citrenbaum
-
Multiple shape attributes can be used within information visualizations. Prior art from many fields and experiments inform what the attributes of shape are and the potential ways that we may effectively utilize shapes to represent multiple data values within an information visualization.
-
2009
-
The Cognitive Playground: Fostering Critical and Creative Thinking with Synthetic Worlds
Synthetic Worlds and Financial Services
Uncharted contributed the following chapters to Working Through Synthetic Worlds:
The Cognitive Playground: Fostering Critical and Creative Thinking with Synthetic Worlds: This chapter explores the potential of synthetic worlds to help individuals learn and practice higher order thinking skills including critical and creative thinking. Such skills are difficult to teach in traditional educational settings and are rarely addressed in common simulation-based training programs.
Synthetic Worlds and Financial Services: Collaborative interactions and transactions among traders, portfolio managers and risk managers can be transformed with synthetic worlds. It is easy to anticipate that by 2025, the reports, analyses and projections from financial industry participants will exist in a shared workspace for dissemination and collaboration that is flexible, adaptable and with high visualization capabilities
-
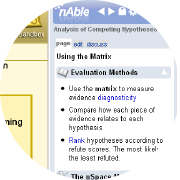
Adaptive user interfaces offer the potential to improve the learnability of software tools and analytic methodologies by tailoring the operation and experience to a user’s needs. Scaffolding is an instructional strategy that can be applied by adaptive interfaces to achieve this. Scaffolding theory suggests that the level of guidance should be adjusted to optimize learning and performance levels. This paper explores the use of adaptive techniques to scaffold user interaction and presents a taxonomy of techniques for adaptive scaffolds within complex software systems. The techniques identified in the proposed taxonomy can help software scaffolds select appropriate adaptations in response to the user’s learning and operating needs. A scaffold called nAble was implemented to explore the application of adaptive techniques from the taxonomy to support an analysis methodology called the Analysis of Competing Hypotheses (ACH).
-
Keynote lecture from the International Conference on Information Visualization
-
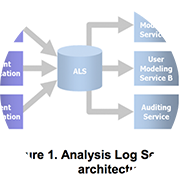
nCompass is a flexible, Service Oriented Architecture (SOA) designed to support the research and deployment of advanced tacit collaboration technology services for analysts. nCompass allows a significantly larger number of individual analytic capabilities, applications and services to be integrated together quickly and effectively.
2008
-
This paper describes nAble, an adaptive scaffolding agent designed to guide new users through the use of an analytic software tool in the ’nSpace Sandbox’ for visual sense-making. nAble adapts the interface and instructional content based on user expertise, learning style and subtask.
-
GeoTime and nSpace2 are interactive visual analytics tools that were used to examine and interpret all four of the 2008 VAST Challenge datasets. GeoTime excels in visualizing event patterns in time and space, or in time and any abstract landscape, while nSpace2 is a web-based analytical tool designed to support every step of the analytical process.
-
This paper traces progress from concept to prototype, and discusses how diagrams can be created, transformed and leveraged for analysis, including generating diagrams from knowledge bases, visualizing temporal concept maps, and the use of linked diagrams for exploring complex, multi-dimensional, sequences of events.
-
Alternative visualization designs provide different solutions that may be more effective for various tasks. Methods such as mechanical, symbolic and natural analogies aid ideation of alternative information visualizations. Issues include metaphor entrapment and implementation effectiveness.
-
GeoTime is a unique capability for analyzing events, objects and activities within a combined temporal and geospatial display. Intelligence analysts can see the who and what in the where and when. CPOF CommandSight Visualizer is the 4D collaborative CPOF workspace component and the integrated visualizer for TAIS the Tactical Airspace Integration System. GeoTime and CPOF CommandSight are currently fielded systems with varying levels of integration with ESRI GIS systems.
2007
-
A story is a powerful abstraction used by intelligence analysts to conceptualize threats and understand patterns as part of the analytical process. This paper demonstrates a system that detects geo-temporal patterns and integrates story narration to increase analytic sense-making cohesion in GeoTime.
-
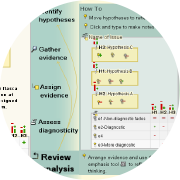
This paper is a detailed case study describing how the nSpace/GeoTime tools created an analytical environment that enabled two novice analysts to examine the scenario, discover patterns, trace connections, assess evidence, visually represent meaningful hypotheses with associated evidence, track progress, collaborate with others and then produce a final report.
-
We will demonstrate an interactive visualization prototype with capabilities for ad hoc exploration that we have not found in other tools for policy analysis outside of the intelligence community. This visual workspace is built on a dynamic butterfly economic model. It enables analysts to examine for policy purposes global trends in consumption, production, imports and exports at national and regional scales and to relate them to population, GDP and income elasticity.
2006
-
GeoTime and nSpace are new analysis tools that provide innovative visual analytic capabilities. This paper uses an epidemiology analysis scenario to illustrate and discuss these new investigative methods and techniques. In addition, this case study is an exploration and demonstration of the analytical synergy achieved by combining GeoTime’s geo-temporal analysis capabilities, with the rapid information triage, scanning and sensemaking provided by nSpace.
-
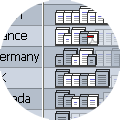
Visualizing spreadsheet content provides analytic insight and visual validation of large amounts of spreadsheet data. Oculus Excel Visualizer is a point and click data visualization experiment which directly visualizes Excel data and re-users the layout and formatting already present in the spreadsheet.
-
This paper presents innovative Sandbox human information interaction capabilities and the rationale underlying them including direct observations of analysis work as well as structured interviews. Key capabilities for the Sandbox include “put-this-there” cognition, automatic process model templates, gestures for the fluid expression of thought, assertions with evidence and scalability mechanisms to support larger analysis tasks.
2005
-
Microsoft Excel has evolved beyond a simple data calculation tool to the point where it is now used as a sophisticated and flexible repository for collecting, analyzing and summarizing data from multiple sources. The power of Excel can be leveraged with visualization in many different ways: enhancing effectiveness, focusing communications, helping make anomalies pop out, facilitating comprehension and empowering collaboration.
-
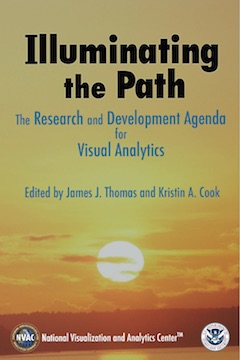
Development of the visual analytics agenda began after a survey of leading universities’ researchers found that traditional views of the needed sciences, such as visualization, did not address the required capabilities. We needed to achieve a broad understanding of the requirements in order to enable the best talents to address the technical challenges. Achieving this understanding required training from those dealing with border protection, emergency response, and analysis. It also required the assembly of a dedicated team of highly motivated people to develop this agenda.
-
When creating a visualization for communication, the inclusion of aesthetically appealing elements can greatly increase a design’s appeal, intuitiveness and memorability. Used without care, this “sizzle” can reduce the effectiveness of the visualization by obscuring the intended message. Maintaining a focus on key design principles and an understanding of the target audience can result in an effective visualization for communication. This paper describes these principles and shows their use in creating effective designs.
-
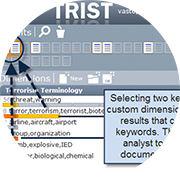
TRIST (“The Rapid Information Scanning Tool”) is the information retrieval and triage component for the analytical environment called nSpace. TRIST uses Human Information Interaction (HII) techniques to interact with massive data in order to quickly uncover the relevant, novel and unexpected.
-
GeoTime is a new paradigm for visualizing events, connections and movement in a combined temporal and spatial visualization. This paper will show how this information visualization capability allows intelligence analysts to quickly reveal relationships between tracked movements and events of interest.
-
The opportunities for competitively harnessing information visualization to drive strategic business advantage are much bigger today than 10 years ago. Choose your visualization solutions carefully; fit is extremely important, and with visualization, a poor fit will show!
-
GeoTime visualization exploits the collection and storage of RFID data, and provides global in-transit visibility of the DoD supply chain down to the last tactical mile.
2004
-
Effective design is crucial for dashboards. A good information design will clearly communicate key information to users and makes supporting information easily accessible.
-
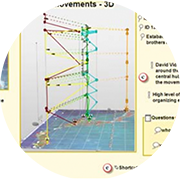
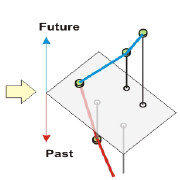
Analyzing observations over time and geography is a common task but typically requires multiple, separate tools. The objective of our research has been to develop a method to visualize, and work with, the spatial inter-connectedness of information over time and geography within a single, highly interactive 3-D view. A novel visualization technique for displaying and tracking events, objects and activities within a combined temporal and geospatial display has been developed. This technique has been implemented as a demonstrable prototype called GeoTime in order to determine potential utility.
2003
-
Paper landscape refers to both an iterative design process and a document as an aid to the design and development process for creating new information visualizations. A paper landscape engages all stakeholders early in the process of creating new visualizations and is used to solicit input; clarify ideas, features, requirements, tasks; and obtain support for the proposal, whether group consensus, market validation or project funding.
2002
-
Several innovative visualization techniques have been developed during the DARPA Command Post of the Future (CPOF) program. One assumption of the program is that information will be gathered electronically from the individual platforms of friendly forces. New visualization techniques, combined with this hi-resolution platform-based or entity-level data, can be used to generate dramatically improved displays of the battlefield. This paper discusses the visualization methods that have been developed for effective presentation of this information to commanders.
-
This paper discusses one technique that became known as ‘blobology’ and which is used to represent self-reporting friendly forces. Blobs evolved over time, in a collaboration with subject matter experts, and this evolution is shown.
-
This paper reports on the experiences of using interactive animated 2D and 3D graphics in an Intrusion Detection (ID) Analysts Workbench prototype. Visualization techniques allow people to see and comprehend large amounts of complex data. Graphics are used to assist with the ID investigation and reporting process by helping the analyst identify significant incidents and reduce false conditions (positives, negatives and alarms).
2000
1999
-
This groundbreaking book defines the emerging field of information visualization and offers the first-ever collection of the classic papers of the discipline, with introductions and analytical discussions of each topic and paper. The authors’ intention is to present papers that focus on the use of visualization to discover relationships, using interactive graphics to amplify thought.
1998
-
The value of information visualization depends on the success of its applications. One important application area is business visualization. To discuss issues and to share experiences and lessons learned in business visualization (bizviz), my colleagues and I in the visualization community conducted a birds-of-a-feather session on business visualization at the IEEE Information Visualization 97 Symposium with 44 spirited attendees. This short note highlights the discussions.
1997
-
“Information visualization methods present multi-dimensional data graphically by mapping data and properties to different visual shapes, colors, and positions… The purpose of visualization is to improve comprehension and reveal significance. It is easier to comprehend a visual representation than a numerical one, especially when the visual representation replaces many pages or screens of data. "
-
From IEEE Computer Graphics and Applications, July issue
-
Information visualization permits users to interactively explore large amounts of data. Poorly designed information visualizations will not reveal insight. Effective visualizations will. Guidelines will aid developers to make effective visualizations. These guidelines serve as a starting point for designing visualizations and as a starting point for further research.
1996
2025
-
Scientific modeling for infectious diseases faces enduring challenges, including limited model transparency, poor traceability of assumptions and uncertainty, and difficulty adapting legacy models amid rapidly evolving scientific knowledge. Terarium is a novel, open-source modeling platform that integrates human-in-the-loop AI to address these gaps. This study presents Terarium and results from a systematic evaluation in epidemiological modeling, assessing its potential to accelerate modeling workflows while improving rigor and interpretability.
-
Journey analytics create sequences that can be understood with graph-oriented visual analytics. We have designed and implemented more than a dozen visual analytics on sequence data in production software over the last 20 years. We outline and demonstrate a variety of data challenges, user tasks, visualization layouts, node and edge representations, and interactions, including strengths and weaknesses of the various approaches. We also discuss how AI and LLMs can significantly improve these analyses.
2024
-
The DARPA Resilient Supply-and-Demand Network (RSDN) program intends to expose and mitigate sources of surprise in supply-demand networks. In addition to DARPA, eight teams are working on solutions. Among them, Uncharted is assembling big data into a graph model with interactive visual analytics combining hierarchical large-scale graph visualization with on-the-fly what-if scenario analysis to uncover and assess systemic risk. In this panel discussion, each team provides a lightning overview of their research.
2023
-
TellFinder is a software platform that enables counter human trafficking investigators to search and visualize many millions of enriched adult service ads from the deep web. In this talk we discuss how TellFinder works and how it has impacted investigations and prosecutions during its active deployment with various agencies.
-
Expert technical analysts are always looking for new techniques to better understand supply, demand, and market prices. In this presentation, we examine the potential of alternative datasets, advanced AI and novel visualizations to reveal market movements.
-
Analysts tasked with solving social problems like human trafficking rely on long-established processes and field experience. Broad artificial intelligence solutions to these problems have good intentions, but they often omit nuance and context that analysts bring. In this talk, we present Uncharted’s approach to designing “augmented intelligence” tools for global resilience that let both humans and machines do what they do best.
2020
-
Visualization has recently gained a foothold in the field of artificial intelligence research. Typically, this work has focused on visualizing modules or specific dynamics of machine learning models, doing so for the purposes of model explainability or for visual debugging. Drawing from ongoing projects involving pandemic analysis and famine shocks, this seminar describes research efforts on graphical modeling where visualization functions as the medium for modeling itself.
-
More data is text than quantitative. Beyond the current standard visualization techniques, so much more is feasible looking across domains and history. Designers, computer scientists and analysts of texts need an expanded visualization vocabulary. This talk illustrates the breadth of design possibilities for using text with visualizations. First, the design space is defined by a review of historic exemplars. Then, using this new design space, text and typography are used to create new kinds of visualization techniques.
2017
-
Text analytics have significantly advanced with techniques such as entity extraction and characterization, topic and opinion analysis, and sentiment and emotion extraction. But the visualization of text has advanced much more slowly. Recent visualization techniques for text, however, are providing new capabilities. In this talk we offer an overview of these new ways to organize massive volumes of text, characterize subjects, score synopses, and skim through a lot of documents. Together, these techniques can improve workflows for users focused on documents.
2015
-
Analysts and data scientists work with large amounts of data, but the common approach, which dates back 20 years, is to roll up all the data into summary tables or charts, resulting in loss of detail. In contrast, direct visual exploratory analysis of massive amounts of raw data can yield insights that are otherwise overlooked. Here we highlight high-density visualizations that directly plot hundreds of millions of data points for applications such as market opportunity, periodicity analysis, and anomaly identification.
-
This session demonstrates using open source tools and techniques for visually exploring massive node-link graphs in a web browser by visualizing all the data. Seeing all the data reveals informative patterns and provides important context to understanding insights. Examples will highlight large-scale graph analysis of social networks, customer purchase history, and healthcare industry data.
2014
-
The open source Aperture Tiles provides interactive data exploration with continuous zooming on large scale datasets. By leveraging big data software stacks Hadoop, Apache Spark and HBase for distributed computation and storage, the technique can scale to data sets with billions of data points or more. In this talk we review the Tile-based visual analytic methodology, challenges and highlight some example applications.
2013
-
Big graphs are difficult to visualize because the scale of the data quickly results in complex network diagrams that can be difficult to decipher and have complicated interfaces with hundreds of options. Instead, we start by understanding what valuable nuggets we are trying to learn from this data, such as “Who’s connected to both me and my competition?” and “Did these people meet?” Starting from the question, we can then simplify the requirements and design effective visualizations that fit the problem. We will look at some mini-case studies and demos (e.g. Twitter correlation network, charity network).
2012
-
This presentation covers some of the challenges and successes with baseball analytics and visualization and generalize some of the lessons learned that could be much more broadly applicable, for example, to retailers or city planners. This was co-presented by Noah Schwartz of Bloomberg Sports and Richard Brath of Oculus.
