Kinetic Interaction
Interfaces are too complicated. We invent more efficient approaches to effortlessly navigate, act and react in highly dynamic environments. Here are some examples from our blog below.


When it comes to productivity tools, we’ve reached the maximum complexity of graphical user interfaces (GUIs): cascading menus, endless dialogue boxes, a plethora of buttons. So what’s the way back to discoverability?
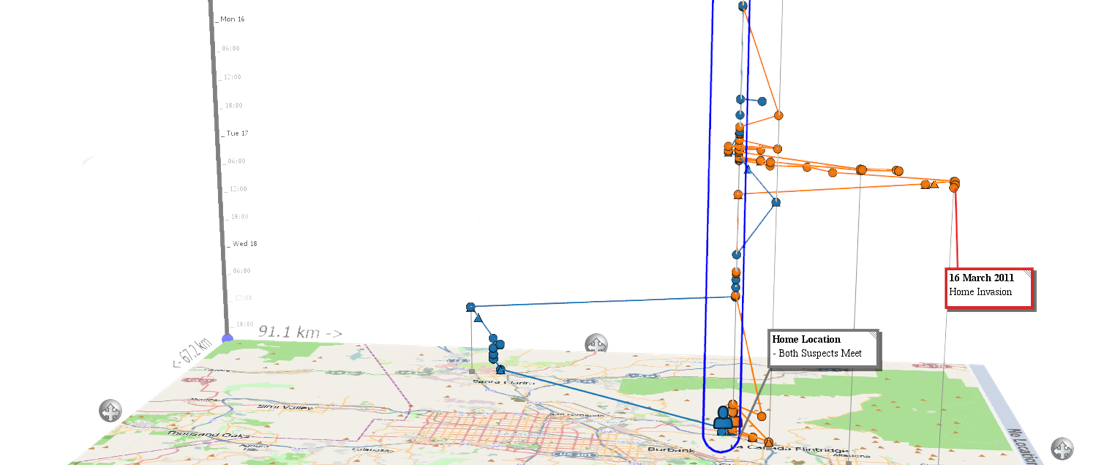
Nearly 20 years ago, Uncharted began research and development on what would become GeoTime. In the novel use of 3D visualization we saw a breakthrough technology for portraying events and movement across space and time.
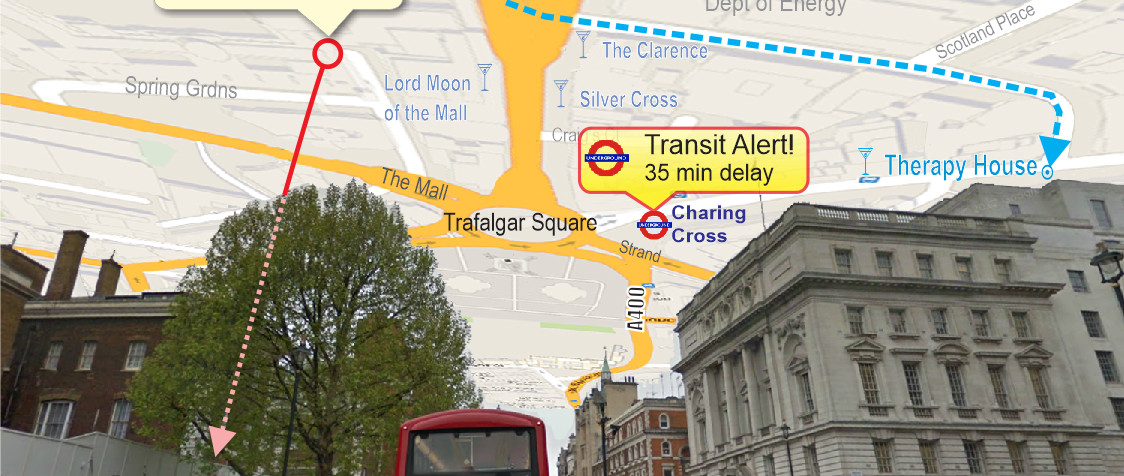
This year at ACM Spatial User Interaction (SUI) 2019 in New Orleans, we won the Best Poster Award for “SkyMap”: World-Scale Immersive Spatial Display, in which we unveiled a fundamentally new wayfinding and spatial situational awareness technique for augmented reality (AR).

What does it mean for a society to go cashless? That’s what we’ll be exploring today at Uncharted.
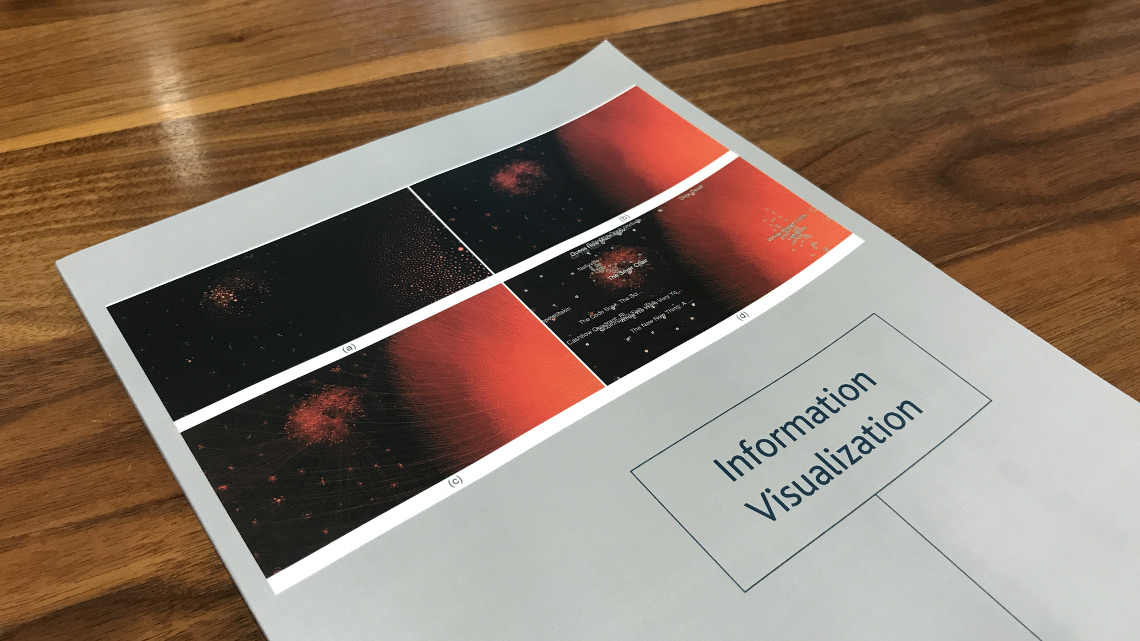
An Uncharted research product for the visual analysis of massive graph data is featured in the pages and on the cover of the latest issue of Information Visualization, a leading peer-reviewed journal on the study and application of information visualization.