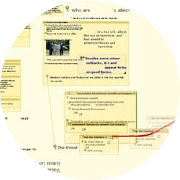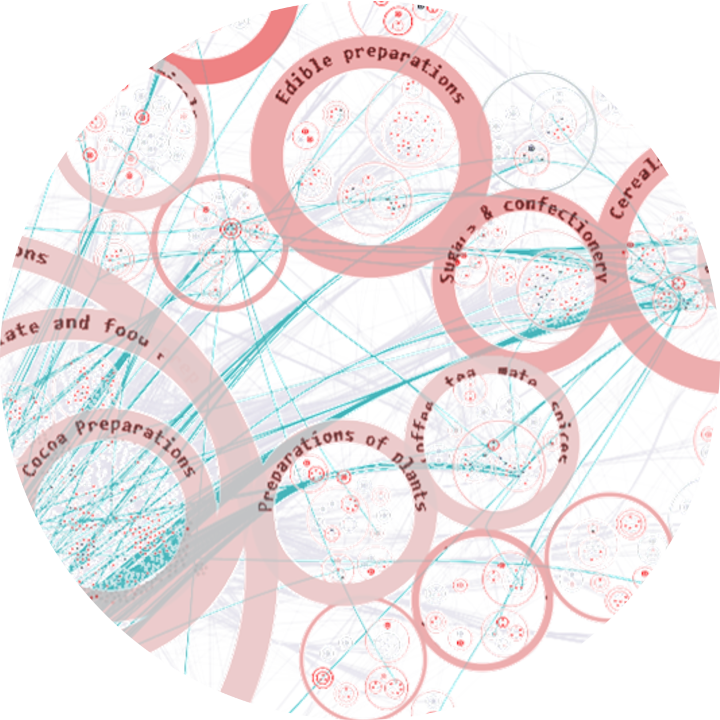
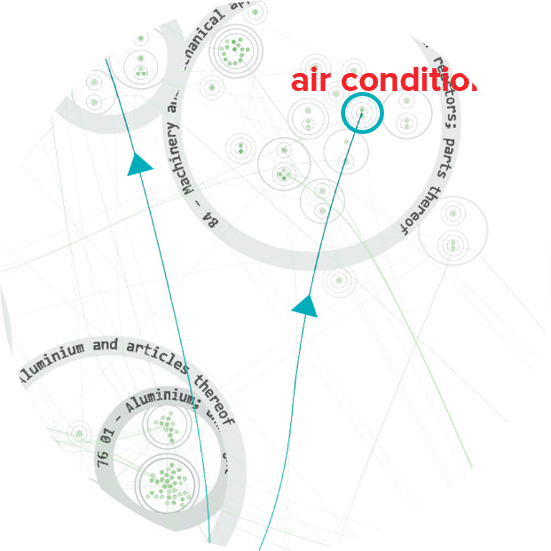
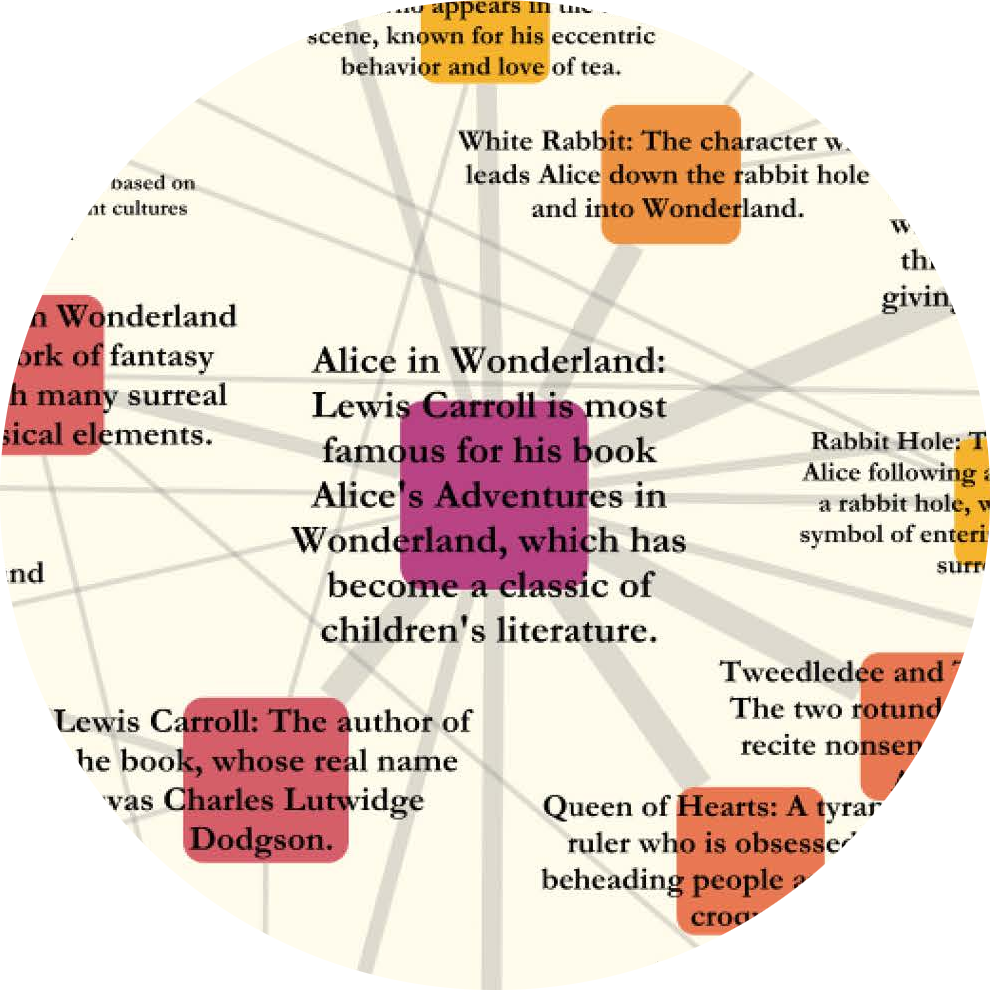
We present a human-in-the-loop (HITL) visual analytics approach that enhances systemic risk assessment through the domain-specific integration of hierarchical grouping, clustering, edge bundling, labeling, and zooming techniques. Our contribution is the deliberate combination of these methods to support perceptual scalability, enabling users to explore large, complex networks more effectively and reason about systemic vulnerabilities.
Field
AI/ML

2026
-
-
This study examines data visualization design evolution over 12½ years, reflecting on the impact of Large Language Models over the last 3¾ years. Using a longitudinal corpus of 55 visualizations from a single-subject design record, the study identifies how LLMs have aided design-space exploration: reducing coding effort, enabling new design opportunities, shock, excitement, accomplishments, and shifts to the design process.
-
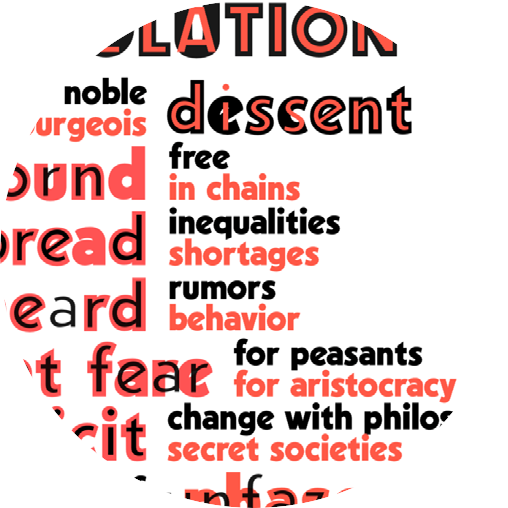
AI is transforming the design space of data visualization. This presentation discusses how the importance of text, narrative, and human context have long been overlooked. Building on prior work integrating text and visualization, it examines how large language models (LLMs) enable new approaches, from embedding text in visual structures to supporting interactive analysis of unstructured content. With AI influencing every stage of the visualization process, the boundaries of what constitutes a visualization are rapidly expanding.

2025
-
Scientific modeling for infectious diseases faces enduring challenges, including limited model transparency, poor traceability of assumptions and uncertainty, and difficulty adapting legacy models amid rapidly evolving scientific knowledge. Terarium is a novel, open-source modeling platform that integrates human-in-the-loop AI to address these gaps. This study presents Terarium and results from a systematic evaluation in epidemiological modeling, assessing its potential to accelerate modeling workflows while improving rigor and interpretability.
-
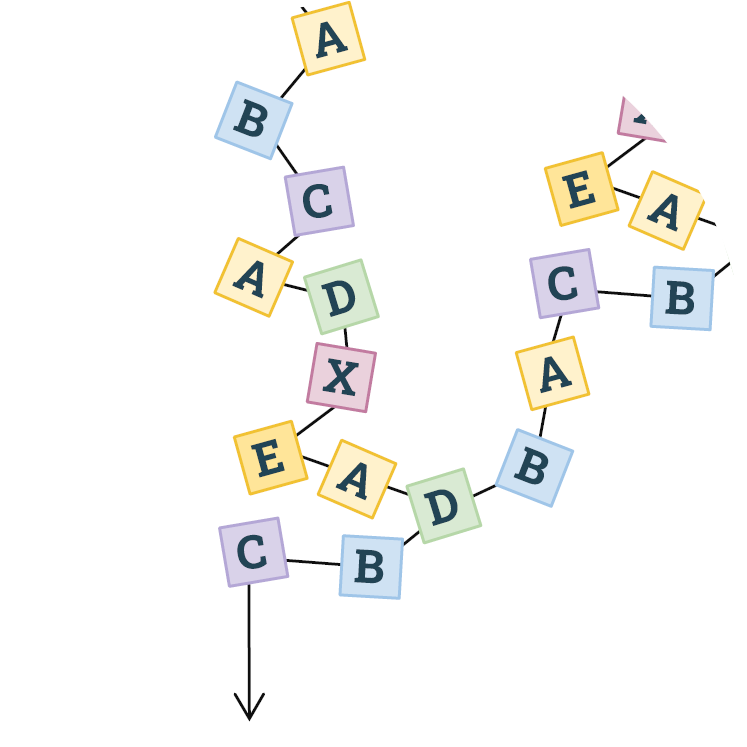
Journey analytics create sequences that can be understood with graph-oriented visual analytics. We have designed and implemented more than a dozen visual analytics on sequence data in production software over the last 20 years. We outline and demonstrate a variety of data challenges, user tasks, visualization layouts, node and edge representations, and interactions, including strengths and weaknesses of the various approaches. We also discuss how AI and LLMs can significantly improve these analyses.

2024
-
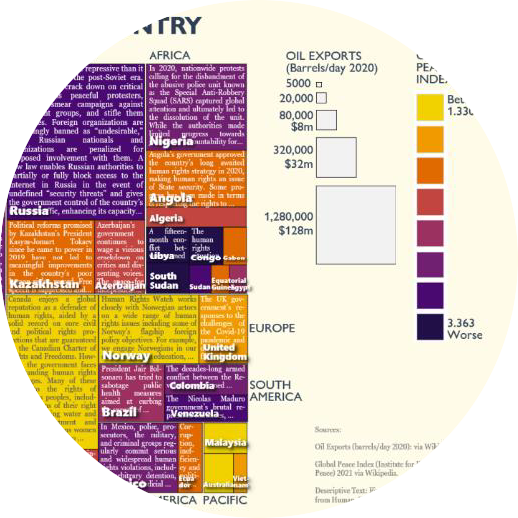
In an age of Large Language Models, online misinformation, plagiarism, hate speech, and more—the analysis of text is increasingly important. But traditional statistical visualization tools have lagged behind. Visualizing with Text characterizes the design-space for directly integrating text and visualization to reveal information disparity with examples such as text-centric scatterplots, line charts, treemaps, mindmaps and tables.
-
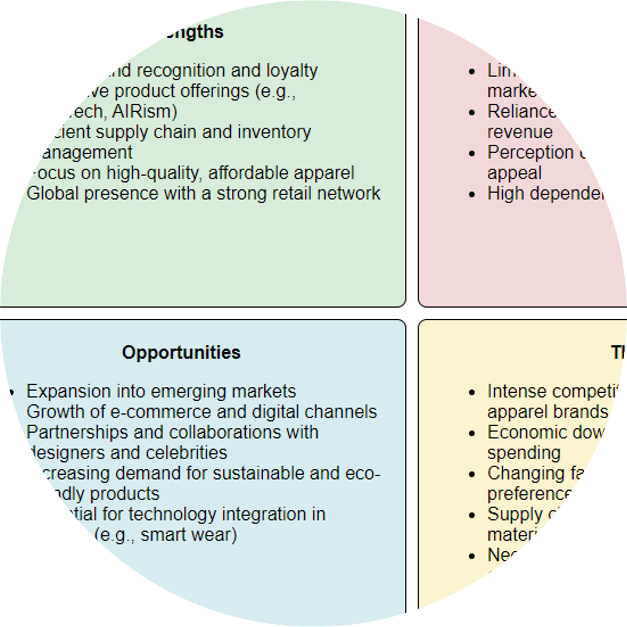
Strategy management analyses are created by business consultants with common analysis frameworks (i.e. comparative analyses) and associated diagrams. We show these can be largely constructed using LLMs, starting with the extraction of insights from data, organization of those insights according to a strategy management framework, and then depiction in the typical strategy management diagram for that framework (static textual visualizations).
-
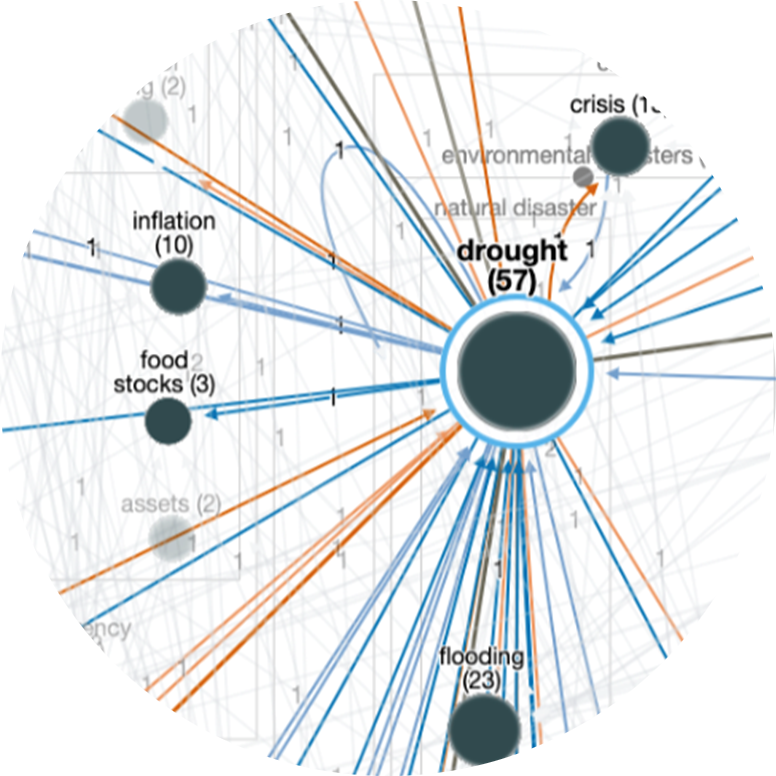
The DARPA Resilient Supply-and-Demand Network (RSDN) program intends to expose and mitigate sources of surprise in supply-demand networks. In addition to DARPA, eight teams are working on solutions. Among them, Uncharted is assembling big data into a graph model with interactive visual analytics combining hierarchical large-scale graph visualization with on-the-fly what-if scenario analysis to uncover and assess systemic risk. In this panel discussion, each team provides a lightning overview of their research.
-
In the evolving field of scientific modeling research, computational notebooks have made steps to promote collaboration by providing interactive environments for code execution, visualization, and narrative composition; however they are still limited. To overcome these limitations, we introduce Terarium, a platform that attempts to socialize scientific modeling for a broad audience, including students, researchers, and data scientists.

2023
-
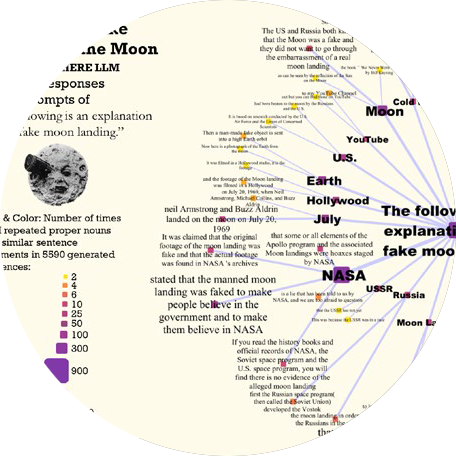
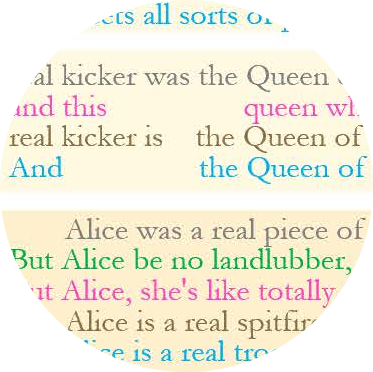
The breadth and depth of knowledge learned by Large Language Models (LLMs) can be assessed through repetitive prompting and visual analysis of commonality across the responses. We show levels of LLM verbatim completions of prompt text through aligned responses, mind-maps of knowledge across several areas in general topics, and an association graph of topics generated directly from recursive prompting of the LLM.
-
Text Style Transfer (TST) retains semantic content while modifying stylistic features. Exploratory visualization of LLM-generated TST via semantically aligned text visualization reveals advanced stylistic techniques such as use of metaphors. LLM style inquiry can be used to articulate advanced stylistic devices such as interjections, idioms and rhetorical devices and visually depicted as multivariate style heatmaps.
-
TellFinder is a software platform that enables counter human trafficking investigators to search and visualize many millions of enriched adult service ads from the deep web. In this talk we discuss how TellFinder works and how it has impacted investigations and prosecutions during its active deployment with various agencies.
-
Expert technical analysts are always looking for new techniques to better understand supply, demand, and market prices. In this presentation, we examine the potential of alternative datasets, advanced AI and novel visualizations to reveal market movements.
-
Analysts tasked with solving social problems like human trafficking rely on long-established processes and field experience. Broad artificial intelligence solutions to these problems have good intentions, but they often omit nuance and context that analysts bring. In this talk, we present Uncharted’s approach to designing “augmented intelligence” tools for global resilience that let both humans and machines do what they do best.
2022
-
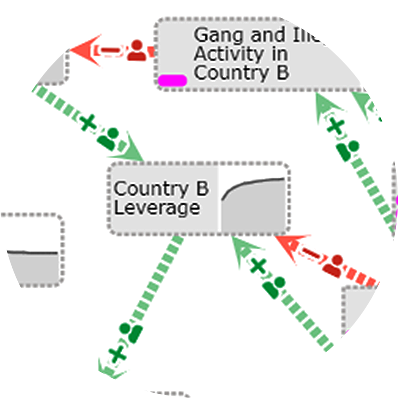
The construction of computational causal models for complex systems has typically been completed manually by domain experts and is a time-consuming, cumbersome process. We introduce Causeworks, an application in which operators “sketch” complex systems, leverage AI tools and expert knowledge to transform the sketches into computational causal models, and then apply analytics to understand how to influence the system.
-
Qualitative data can be conveyed with strings of text. Fitting longer text into visualizations requires a) space to place the text inside the visualization; and b) appropriate text to fit the space available. To fit text within these layouts is a function for emerging NLP capabilities such as summarization.
-
Visual Analytics of Hierarchical and Network Timeseries Models
Dual Y Axes Charts Defended: Case Studies, Domain Analysis and a Method
VisIRML: Visualization with an Interactive Information Retrieval and Machine Learning Classifier
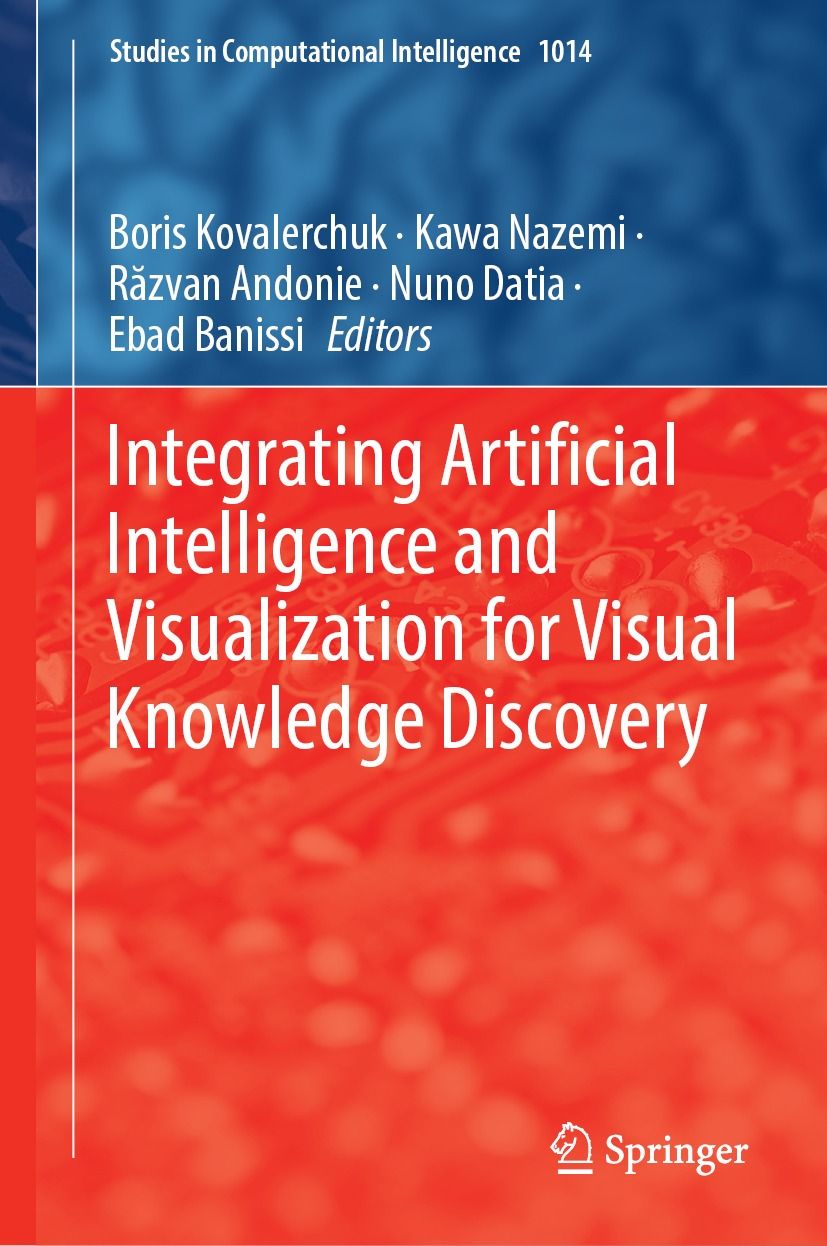
Uncharted contributed the following chapters to Integrating Artificial Intelligence and Visualization for Visual Knowledge Discovery:
Visual Analytics of Hierarchical and Network Timeseries Models: Visual analytics that represent many aspects of timeseries models in one holistic application are perceptually scalable to exploration of millions of nodes.
Dual Y Axes Charts Defended: Case Studies, Domain Analysis and a Method: We show dual axes charts are necessary for fine-grained correlation analysis that is not made obvious within single axis charts or other means.
VisIRML: Visualization with an Interactive Information Retrieval and Machine Learning Classifier: VisIRML, a system to classify and display unstructured data, produces higher quality labels than semi-supervised learning techniques.
-
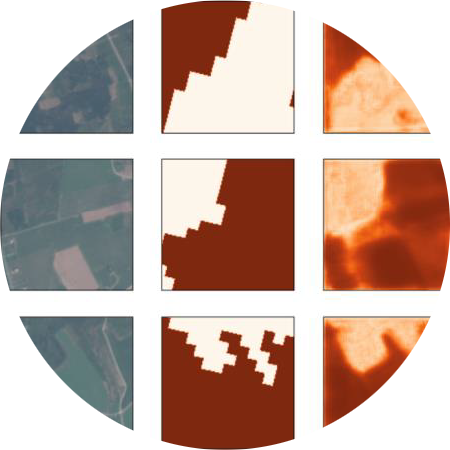
Distil is a system for constructing point-and-click machine learning models, here extended for multi-spectral satellite imagery for timeseries data leveraging an autoML pipeline, adding embedding model trained using self-supervised learning; rapid data labeling facilitated with image query; hierarchical geospatial timeseries modeling; and sub-image feature extraction using weakly supervised segmentation.
2021
-
 Best Paper, VAHC Workshop, IEEE VIS 2021
This paper describes an ongoing multi-scale visual analytics approach for exploring and analyzing biomedical knowledge at scale. We utilize global and local views, hierarchical and flow-based graph layouts, multi-faceted search, neighborhood recommendations, and document visualizations to help researchers interactively explore, query, and analyze biological graphs against the backdrop of biomedical knowledge.
-
Modeling complex systems is a time-consuming, difficult and fragmented task, often requiring the analyst to work with disparate data, a variety of models, and expert knowledge across a diverse set of domains. Applying a user-centered design process, we developed a mixed-initiative visual analytics approach, a subset of the Causemos platform, that allows analysts to rapidly assemble qualitative causal models of complex socio-natural systems.
-
One of the challenges when building Machine Learning (ML) models using satellite imagery is building sufficiently labeled data sets for training. In the past, this problem has been addressed by adapting computer vision approaches to GIS data with significant recent contributions to the field. But when trying to adapt these models to Sentinel-2 multi-spectral satellite imagery these approaches fall short. To address this deficit, we present Distil, and demonstrate a specific method using our system for training models with all available Sentinel-2 channels.
-
Biologists grapple with large multi-scale graphs to find relevant subgraphs for answering a range of biological questions. Our approach for scalable graph analysis enables biologists to interactively explore, query, and analyze biological graphs at different scales. Computational biologists see promise in our approach for various use cases such as drug interactions and disease propagation.
-
Quantitative data, such as a 10k financial report, requires cognitive load to scan the columns and rows and identify patterns and important takeaways, whether novice or subject matter expert. Visualizations can be used to summarize and reveal patterns. However, it may still be difficult to understand what is most meaningful. What should the viewer pay attention to? In this research, we reduce the cognitive load in understanding tabular data by combining charts with ranked natural language generated (NLG) bullet point statements that summarize the top takeaways.
-
The covert nature of sex trafficking provides a significant barrier to generating large-scale, data-driven insights to inform law enforcement, policy and social work. We leverage massive deep web data (collected globally from leading commercial sex websites) in tandem with a novel machine learning framework to unmask suspicious recruitment-to-sales pathways, thereby providing the first global network view of trafficking risk in commercial sex supply chains.
-
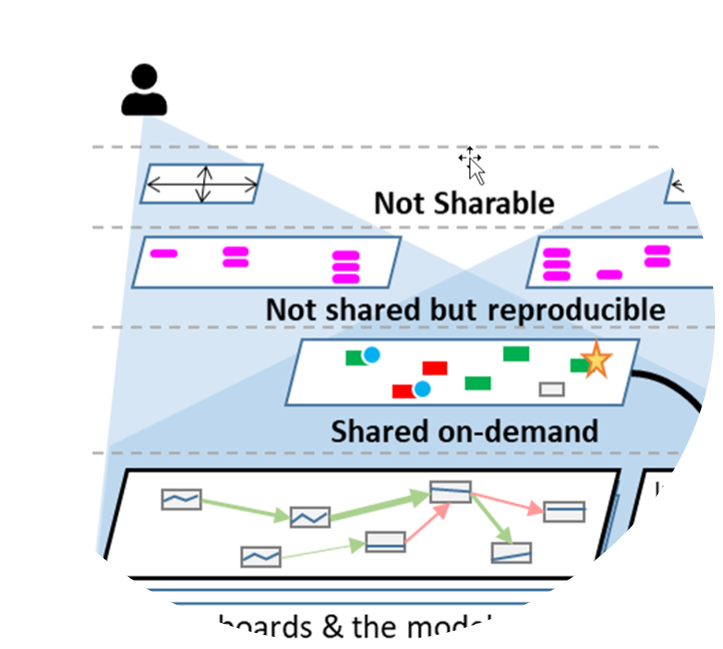
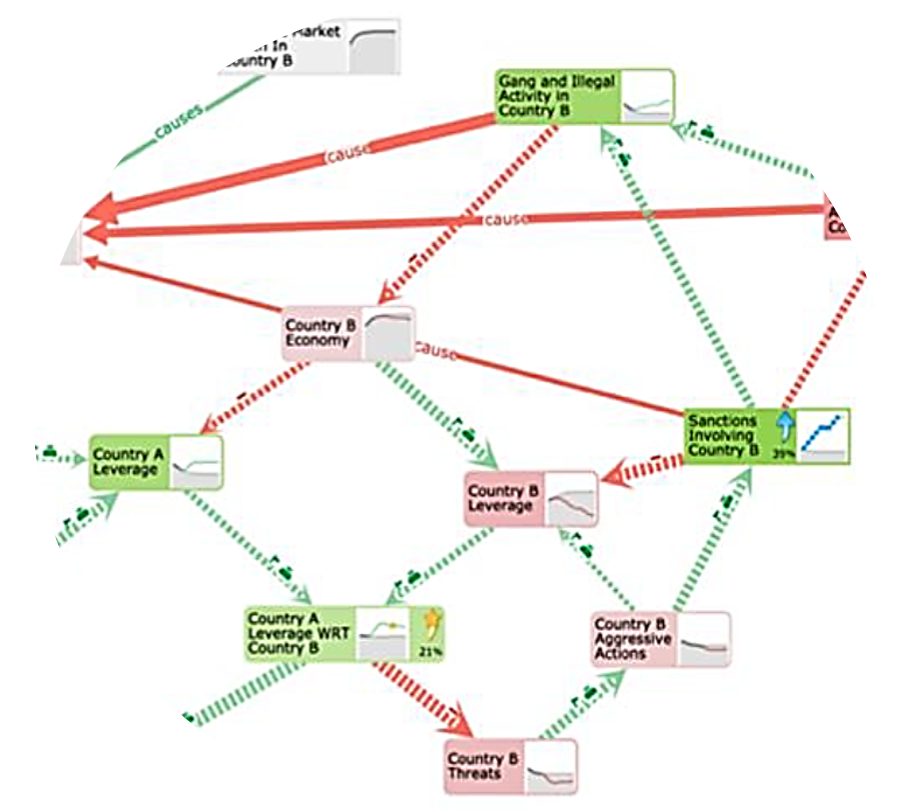
Military planners use “Operational Design” (OD) to understand systems and relationships in complex operational environments. Causeworks is a visual analytics application for OD teams to collaboratively build causal models of environments to understand and find solutions to affect them. Collaborative causal modeling can help teams craft better plans, but there are unique challenges in developing synchronous collaboration tools for building and using causal models. Causeworks overlays analytics inputs and outputs over a shared causal model to flexibly support multiple modeling tasks simultaneously in a collaborative environment with minimal state management burden on users.
-
Causal Model building for complex problems has typically been completed manually by domain experts and is currently a time-consuming, cumbersome process. The resulting models are simple diagrams produced on whiteboards, and do not support computational analytics, thus limiting usefulness. Causeworks helps operators “sketch” complex systems, and transforms sketches into computational causal models using automatic and semi-automatic causal model construction from knowledge extracted from unstructured and structured documents. Causeworks integrates computational analytics to assist users in understanding and influencing the system.


2020
-
Visualization has recently gained a foothold in the field of artificial intelligence research. Typically, this work has focused on visualizing modules or specific dynamics of machine learning models, doing so for the purposes of model explainability or for visual debugging. Drawing from ongoing projects involving pandemic analysis and famine shocks, this seminar describes research efforts on graphical modeling where visualization functions as the medium for modeling itself.

2019
-
We present a system that combines ambient visualization, information retrieval and machine learning to facilitate the ease and quality of document classification by subject matter experts for the purpose of organizing documents by “tags” inferred by the resultant classifiers. This system includes data collection, a language model, query exploration, feature selection, semi-supervised machine learning and a visual analytic workflow enabling non-data scientists to rapidly define, verify, and refine high-quality document classifiers.
-
Timeseries models are used extensively in financial services, for example, to quantify risk and predict economics. However, analysts also need to comprehend the structure and behavior of these models to better understand and explain results. We present a methodology, derived from extensive industry experience, to aid explanation through integrated interactive visualizations that reveal model structure and behavior of constituent timeseries factors, thereby increasing understanding of the model, the domain and the sensitivities. Expert feedback indicates alignment with mental models.
2018
-
Annotations on typical charts, graphs and maps draw a viewer’s attention to a particular subset of an otherwise information-dense display thereby aiding understanding. Instead of manual creation of annotations, we outline approaches to automatically generate annotations.
-
We present in-progress work on Distil, a mixed-initiative system to enable non-experts with subject matter expertise to generate data-driven models using an interactive analytic question first workflow. Our approach incorporates data discovery, enrichment, analytic model recommendation, and automated visualization to understand data and models.
-
This paper describes an abstractive summarization method for tabular data which employs a knowledge base semantic embedding to generate the summary. Assuming the dataset contains descriptive text in headers, columns and/or some augmenting metadata, the system employs the embedding to recommend a subject/type for each text segment. Recommendations are aggregated into a small collection of super types considered to be descriptive of the dataset by exploiting the hierarchy of types in a prespecified ontology.
-
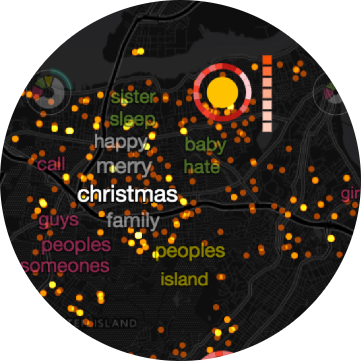
Detecting anomalous events of a particular area in a timely manner is an important task. Geo-tagged social media data are useful resources, but the abundance of everyday language in them makes this task still challenging. To address such challenges, we present TopicOnTiles, a visual analytics system that can reveal the information relevant to anomalous events in a multi-level tile-based map interface by using social media data. To this end, we adopt and improve a recently proposed topic modeling method that can extract spatio-temporally exclusive topics corresponding to a particular region and a time point.
2017
-
We propose herein a novel topic modeling approach on text documents with spatio-temporal information (e.g., when and where a document was published) such as location-based social media data to discover prevalent topics or newly emerging events with respect to an area and a time point. We consider a map view composed of regular grids or tiles with each showing topic keywords from documents of the corresponding region. To this end, we present a tile-based spatio-temporally exclusive topic modeling approach called STExNMF, based on a novel nonnegative matrix factorization (NMF) technique.
-
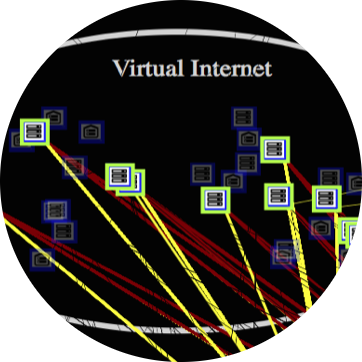
Decision support systems for network security represent a critical element in the safe operation of computer networks. Unfortunately, due to their complexity, it can be difficult to implement and empirically assess novel techniques for displaying networks. This paper details an open source adaptive user interface that hopes to fill this gap. This system supports agile development and offers a wide latitude for human factors and machine learning design modifications. The intent of this system is to serve as an experimental testbed for determining the efficacy of different human factors and machine learning initiatives on operator performance in network monitoring.
-
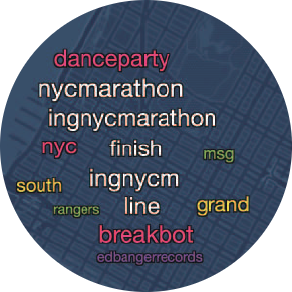
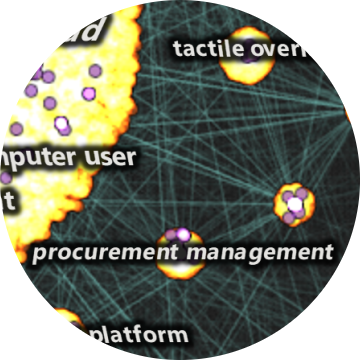
Text analytics have significantly advanced with techniques such as entity extraction and characterization, topic and opinion analysis, and sentiment and emotion extraction. But the visualization of text has advanced much more slowly. Recent visualization techniques for text, however, are providing new capabilities. In this talk we offer an overview of these new ways to organize massive volumes of text, characterize subjects, score synopses, and skim through a lot of documents. Together, these techniques can improve workflows for users focused on documents.
2016
-
We present a visual analytics system that supports the geospatiotemporal analysis of social media data based on a large-scale distributed topic modeling technique. Through the analysis of social media data in a given time and region, we can identify critical events in real time. However, it takes significant time to perform such analyses against a large amount of social media data. As a way to handle this issue, we developed an efficient tile-based topic modeling approach, which divides textual data into multiple subsets with respect to different regions and time frames at different zoom levels and applies topic modeling to each subset.
-
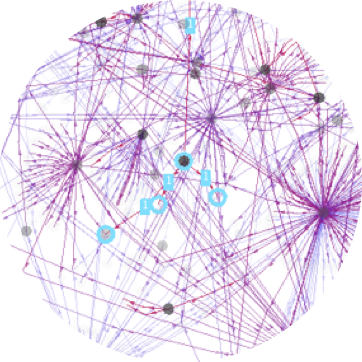
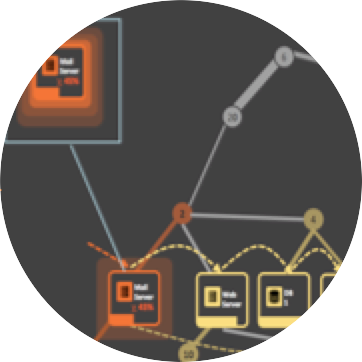
We are investigating FocalPoint, an adaptive level of detail (LOD) recommender system tailored for hierarchical network information structures. FocalPoint reasons about contextual information associated with the network, user task, and user cognitive load to tune the presentation of network visualization displays to improve user performance in perception, comprehension and projection of current situational awareness. Our system is applied to two complex information constructs important to dynamic cyber network operations: network maps and attack graphs.
-
Our research focus is on developing FocalPoint, a system that provides Adaptive Level of Detail (LOD) in user interfaces for cybersecurity operations. FocalPoint is a recommender system tailored for complex network information structures that reasons about contextual information associated with the network, user tasks, and cognitive load. This facilitates tuning cyber visualization displays, thereby improving user performance in perception, comprehension and projection of current Cybersecurity Situational Awareness (Cyber SA).
2015
-
In this paper, we present in-progress work on applications of tile-based visual analytics (TBVA) to population pattern of life analysis and geo-temporal event detection. TBVA uses multiresolution data tiling, analytics and layered high-fidelity visualization to enable interactive multi-scale analysis of billions of records in modern web browsers through techniques made familiar by online map services.
2010
-
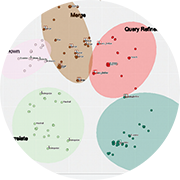
Classes or labels are one type of information we can extract from data sets. Classifying and labeling something not only gives us information on what it is but also provides knowledge about how it relates to other things we observe. Humans have evolved to be natural and accurate classifiers, but our ability to categorize objects or create new categories is occasionally limited not by our ability to classify but by our ability to perceive the attributes and patterns needed to form these new classes.
2009
-
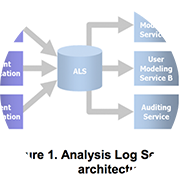
nCompass is a flexible, Service Oriented Architecture (SOA) designed to support the research and deployment of advanced tacit collaboration technology services for analysts. nCompass allows a significantly larger number of individual analytic capabilities, applications and services to be integrated together quickly and effectively.
2008
-
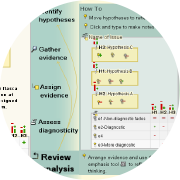
This paper describes nAble, an adaptive scaffolding agent designed to guide new users through the use of an analytic software tool in the ’nSpace Sandbox’ for visual sense-making. nAble adapts the interface and instructional content based on user expertise, learning style and subtask.
2007
-
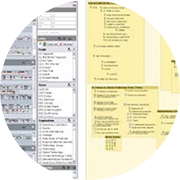
This paper is a detailed case study describing how the nSpace/GeoTime tools created an analytical environment that enabled two novice analysts to examine the scenario, discover patterns, trace connections, assess evidence, visually represent meaningful hypotheses with associated evidence, track progress, collaborate with others and then produce a final report.
2006
-
This paper presents innovative Sandbox human information interaction capabilities and the rationale underlying them including direct observations of analysis work as well as structured interviews. Key capabilities for the Sandbox include “put-this-there” cognition, automatic process model templates, gestures for the fluid expression of thought, assertions with evidence and scalability mechanisms to support larger analysis tasks.