Blog
In examining how technology advancements play a crucial role in uncovering human trafficking, Medium’s OneZero notes how TellFinder “slaloms through terabytes of the deep web to search where Google can’t”.

Intelligence analysts, criminal investigators and legal practitioners frequently face complex cases with large volumes of ambiguous, uncertain, contradictory or inconclusive evidence. They must rapidly analyze the evidence, assess the situation and recommend options with clear justification to decision makers. Moreover, inherent human cognitive biases, such as neglect of probability, confirmation bias and recency bias further complicate objective analysis.
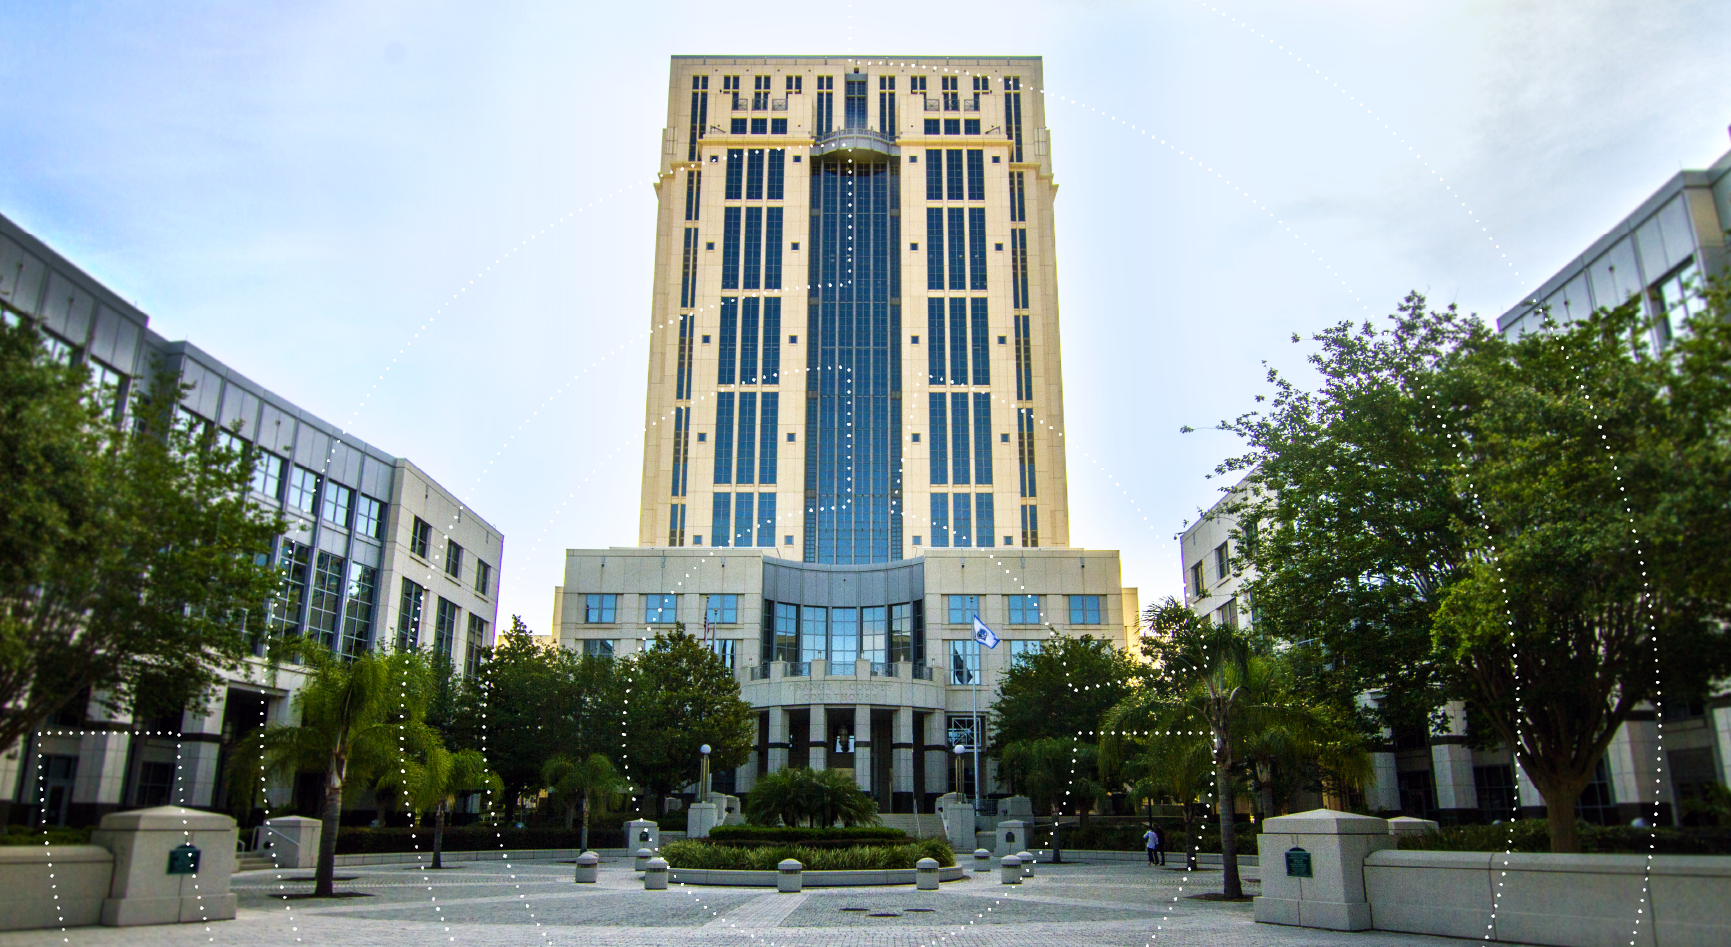
Data from TellFinder was admitted as evidence for the first time in a US court in a 2019 human trafficking trial in the Ninth Judicial Circuit of Florida.
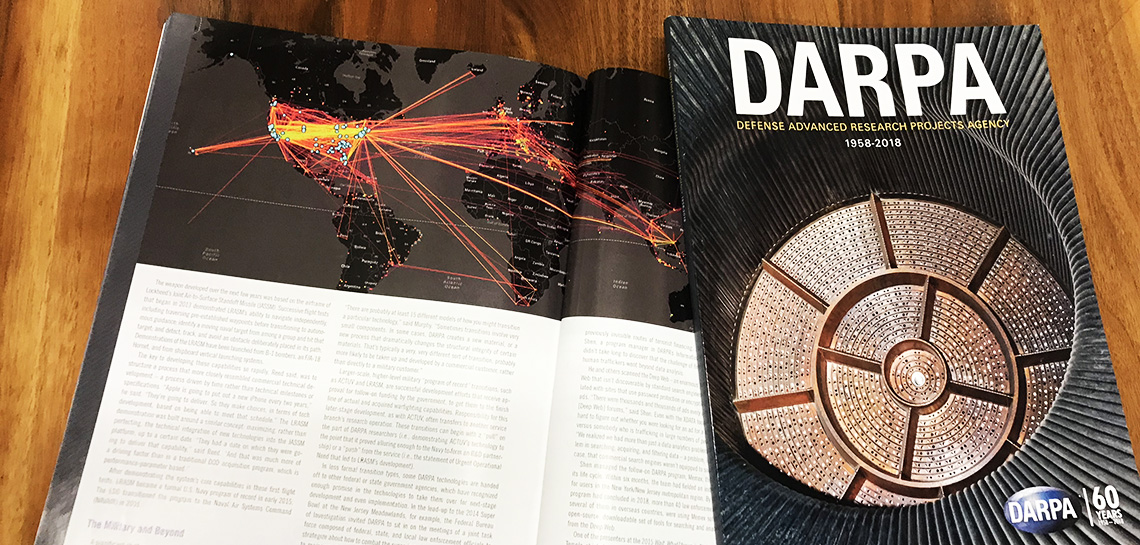
Uncharted congratulates DARPA on its recent 60th anniversary. For nearly 20 years, we have worked with leading minds on “DARPA-hard” technology challenges. This immense privilege has afforded us the opportunity to apply thought, design, and implementation leadership in the data-driven art and science of visual analytics to new breakthroughs in human empowerment.
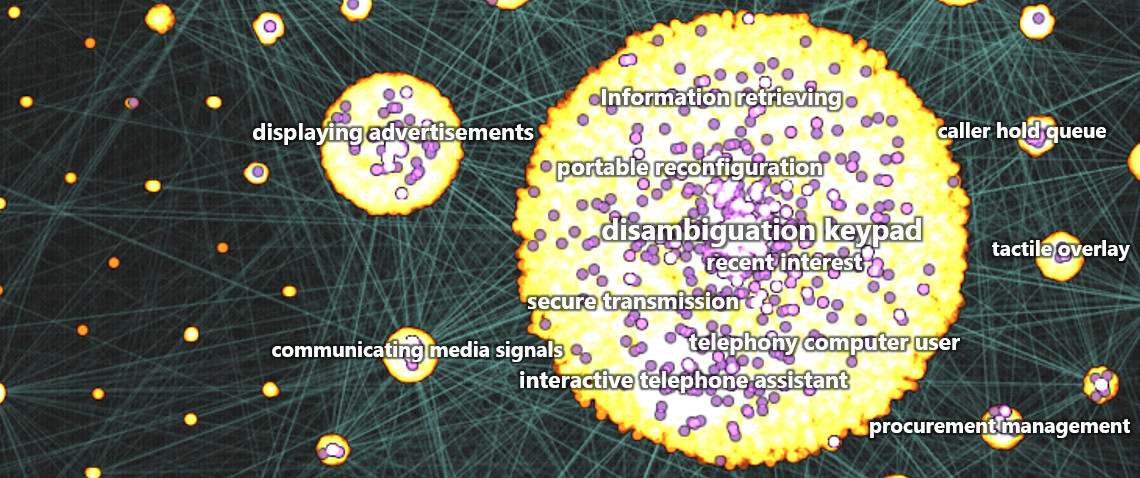
Since the advent of Gutenberg’s press, typesetting has relegated text to the margins of visualization: legends, axes, captions and footnotes. But modern web-based platforms can infuse rich textual information into interactive graphs and charts.