Enhanced Perception
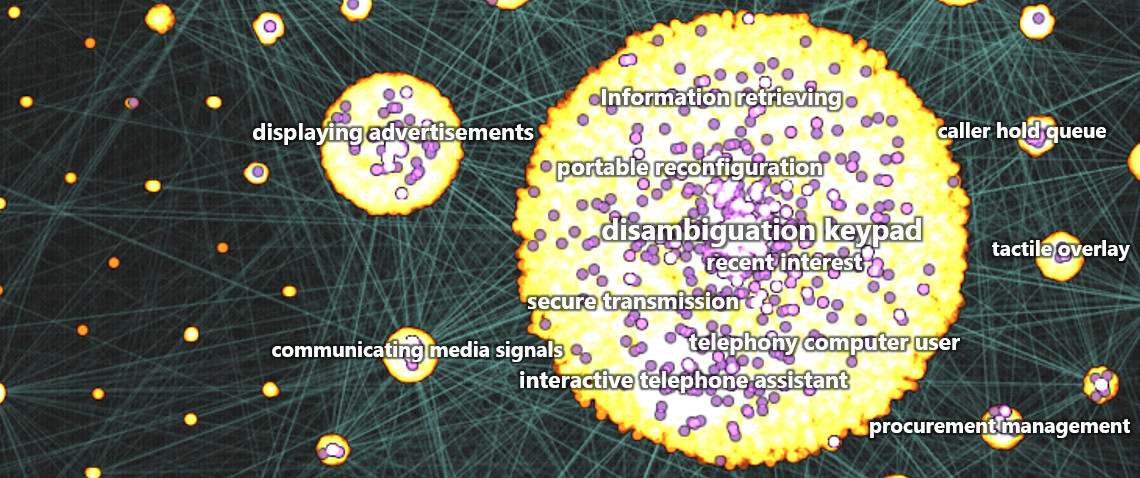
Basic charts don't scale. We empower people to more easily understand complex situations by designing profoundly visual information systems. Here are some examples from our blog below.

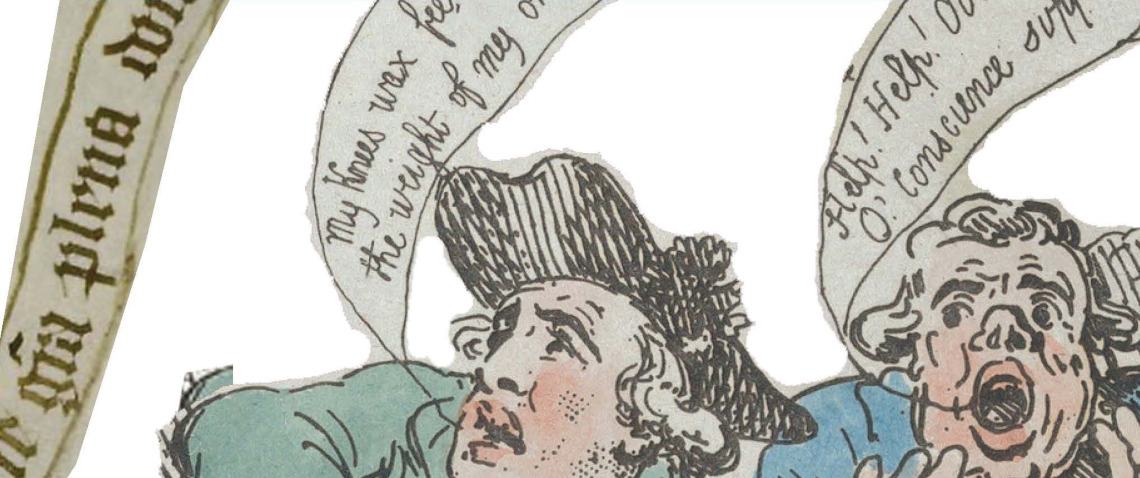
In his new book, Richard Brath, Managing Partner, Commercial Innovations, presents a variety of text format and layout techniques for “richer, more expressive visualizations”
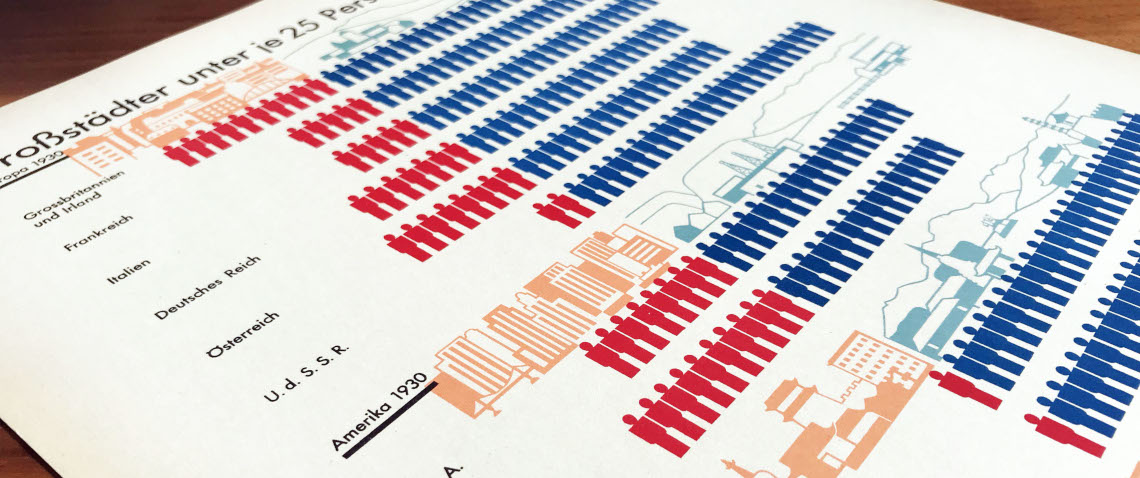
Finding inspiration in Neurath’s historic picture language

The identification of an international sex trafficking network using TellFinder technology in 2017 led to more than a dozen, coordinated FBI-led sting operations on January 15, 2019.
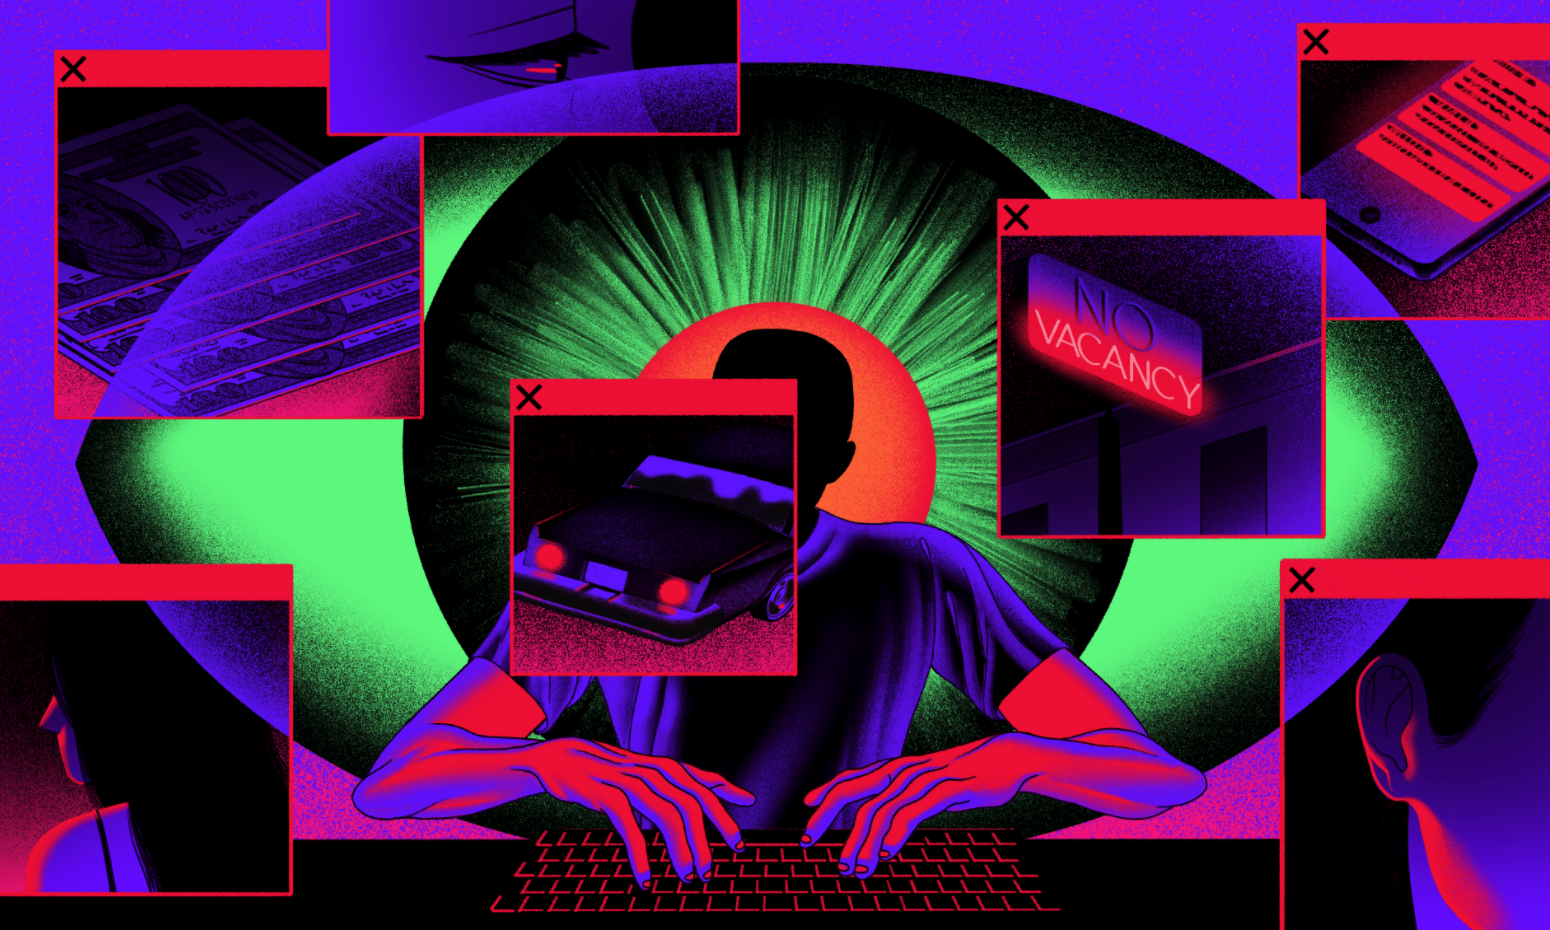
In examining how technology advancements play a crucial role in uncovering human trafficking, Medium’s OneZero notes how TellFinder “slaloms through terabytes of the deep web to search where Google can’t”.
Since the advent of Gutenberg’s press, typesetting has relegated text to the margins of visualization: legends, axes, captions and footnotes. But modern web-based platforms can infuse rich textual information into interactive graphs and charts.