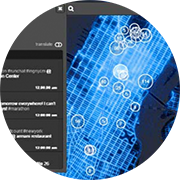
Detecting anomalous events of a particular area in a timely manner is an important task. Geo-tagged social media data are useful resources, but the abundance of everyday language in them makes this task still challenging. To address such challenges, we present TopicOnTiles, a visual analytics system that can reveal the information relevant to anomalous events in a multi-level tile-based map interface by using social media data. To this end, we adopt and improve a recently proposed topic modeling method that can extract spatio-temporally exclusive topics corresponding to a particular region and a time point.

2018
2016
-
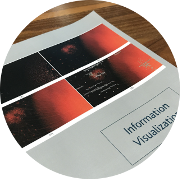
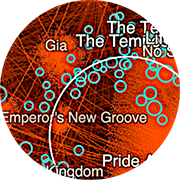
Graph visualizations increase the perception of entity relationships in a network. However, as graph size and density increases, readability rapidly diminishes. In this cover article for the July 2017 edition of the Information Visualization journal, we present an end-to-end, tile-based visual analytic approach called graph mapping that utilizes cluster computing to turn large-scale graph (node-link) data into interactive visualizations in modern web browsers.
2015
-
Graph visualizations increase the perception of entity relationships in a network. However, as graph size and density increases, readability rapidly diminishes. In this paper, we present a tile-based visual analytic approach that leverages cluster computing to create large-scale, interactive graph visualizations in modern web browsers. Our approach is optimized for analyzing community structure and relationships.
-
In this paper, we present in-progress work on applications of tile-based visual analytics (TBVA) to population pattern of life analysis and geo-temporal event detection. TBVA uses multiresolution data tiling, analytics and layered high-fidelity visualization to enable interactive multi-scale analysis of billions of records in modern web browsers through techniques made familiar by online map services.


