What if you could move freely through Manhattan and watch every licensed taxi pick up and drop off every one of its passengers at the same time? What movement patterns would you see? That’s what we aimed to find out by extending our Salt library to plot high-density New York City traffic data in three dimensions.
We’ve used Salt before to visualize NYC taxi data. Below, a multi-scale geographic heatmap illustrates all taxi pick-up (orange) and drop-off (blue) locations in the city during 2013. As you can see, this interactive, web-based map depicts where people start and end their trips both at global and street-level views. But plotting the data on just two dimensions can confine our ability to understand daily patterns of life in aggregate.
With this in mind, we ran the same data through Salt again, but instead we added another axis extending vertically above the base map. This axis represents time of day, starting at 12 AM at the bottom and terminating at 11:59 PM at the top. Along the axis, we plotted all taxi pick ups and drop offs according to where and when they occurred in a given day. Effectively, we now have a 3D model of NYC taxi trip endpoints that highlights not only geographic hotspots, but also uncovers how time of day influences traffic.
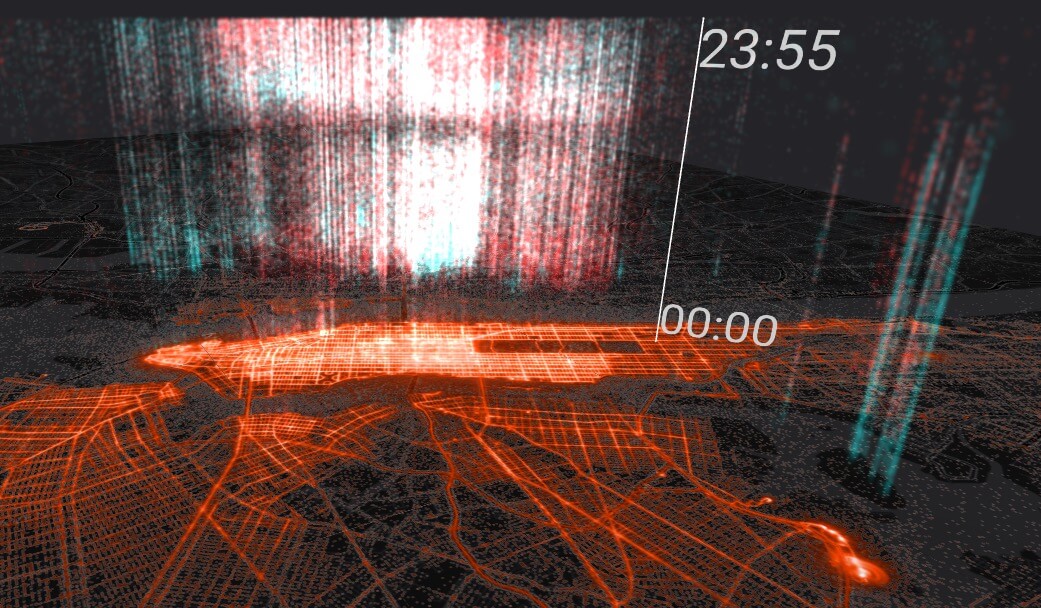
While even a 2D cross section of our new model might reveal interesting patterns, we wanted to understand how a fully interactive 3D version would aid in perception of such high-density data. So we brought Salt into virtual reality with Android and Google Cardboard.
Navigation in the NYC taxi data app is simple: tilt your head left to zoom in or right to zoom out, and click Cardboard’s Select/Action button to “walk” in the general direction you’re looking. Navigating around Manhattan, you can get a sense of how people move about the city. For example, regardless of time of day, taxis appear to be dropping off more passengers than they pick up in Lower Manhattan.
Three-dimensional visualization also aids perception of the depth of high-density data and understanding of where it is anchored in space. These abilities lend themselves to discovering temporal patterns inherent in everyday life. For example, the morning rush of taxi pick-ups in midtown and uptown Manhattan seems to begin just before 5:00 AM, while the bulk of drop-offs don’t start arriving in downtown Manhattan until roughly 5:30 AM. Also, a dark band in the late afternoon indicates a lull in activity across all areas of the city. Close inspection puts this lull around 4:30 PM, which is right around the time when taxis typically changeover between the day and night shifts.
Overall, we think that the ability to immerse oneself directly in an interactive 3D model of massive pattern-of-life data could reveal anomalies that are not readily apparent in other mediums.