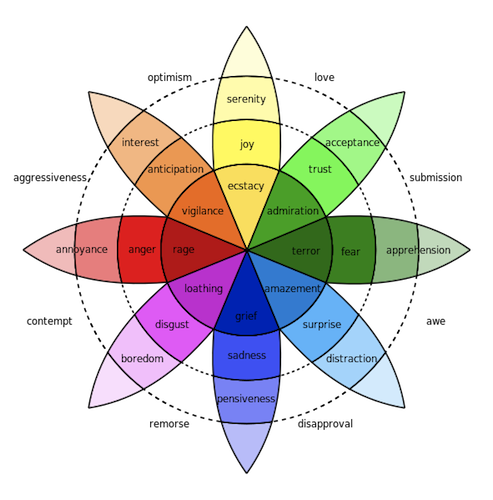
While sentiment analysis on Twitter data has become commonplace, Uncharted’s Richard Brath got us thinking about going deeper and looking at the emotional content. Plutchik defines a taxonomy of 8 core emotions, often illustrated by his “wheel of emotions” (below). Saif Mohammed crowd-sourced a lexicon of about 10,000 words that can be used to measure the emotional content of text using a similar approach to sentiment analysis. We thought that the first 2016 Presidential Debate was a perfect opportunity to take emotion analysis for a test drive.

We started by collecting tweets before, during, and after the debate that mentioned Donald Trump, his campaign slogans, or hashtags that are typically associated with him - the same approach we used in previous posts. We did the same for Hillary Clinton. The result was about 1.5 million tweets mentioning Trump, 1 million mentioning Clinton.
Next, we ran all of the collected tweets through our emotional measurement algorithm using Mohammed’s lexicon and collected them into one-minute buckets. For each one-minute bucket we counted the number of tweets scoring for each emotion and normalized by the total number of tweets collected in the bucket. We also recorded the top scoring words in the emotion lexicon for the tweets in the bucket to help provide context. This gave us a percentage-measure of emotion at a one-minute resolution and the basis for a pretty interesting time-series.
For a variety of reasons, the overall score for some emotions was consistently higher than others - for example, Joy was nearly twice as common than disgust. We were interested in seeing how the Twitter universe’s emotions change over the course of the debate so we normalized each emotion’s series by the average value of that emotion over the time period. The result follows.
