Uncharted Technology
Explaining Complex Systems and Predictions
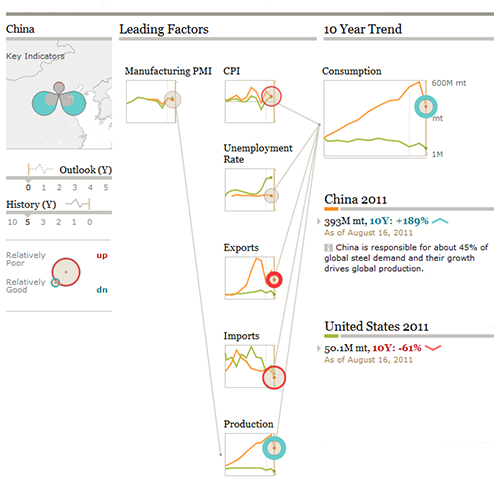
Autogenerated, interactive, story-driven visualization speaks to a wider audience and promotes deeper understanding of patterns and anomalies in data. Narrative sequences communicate observations, enabling a community to understand, to see for themselves, and to contribute. In this application story threads emerge as the user interactively drills-down to explore deeper underlying factors and scenarios. Unlike paper reports, live graphic presentations are up-to-date with the latest data and commentary.