Uncharted Research
Visualizing with Text: Bringing Content to the Fore to Better Assess (Mis)information
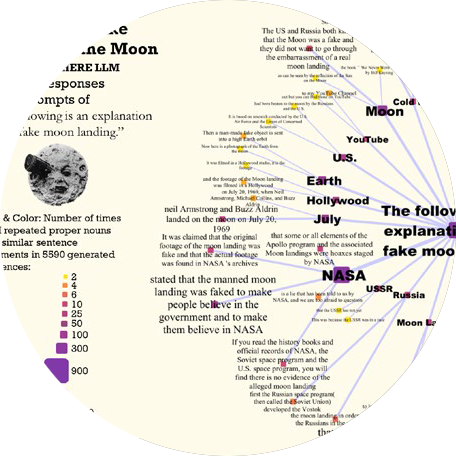
In an age of Large Language Models, online misinformation, plagiarism, hate speech, and more—the analysis of text is increasingly important. But traditional statistical visualization tools have lagged behind. Visualizing with Text characterizes the design-space for directly integrating and visualization to reveal information disparity with examples such as text-centric scatterplots, line charts, treemaps, mindmaps and tables.
