Uncharted Research
Visual Journey Analytics
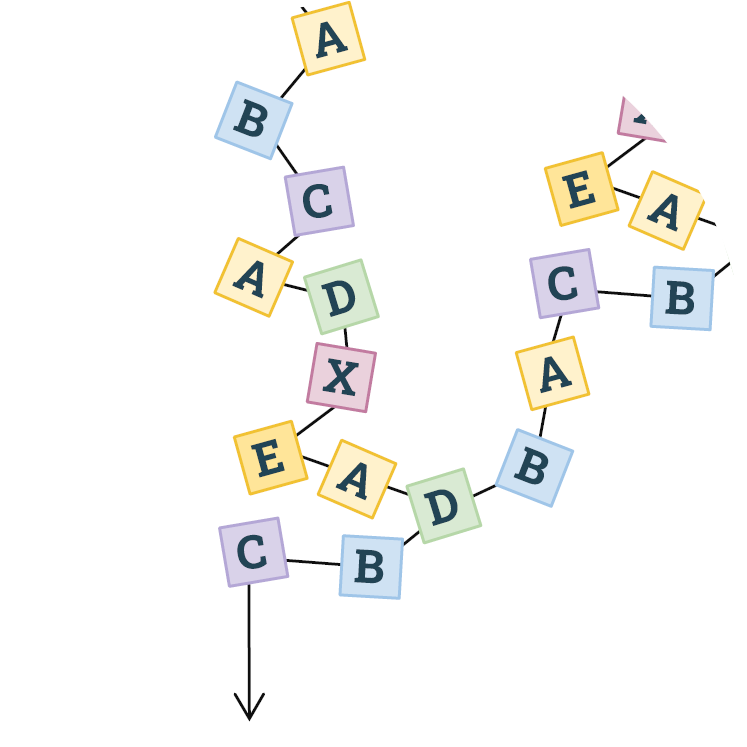
Journey analytics create sequences that can be understood with graph-oriented visual analytics. We have designed and implemented more than a dozen visual analytics on sequence data in production software over the last 20 years. We outline and demonstrate a variety of data challenges, user tasks, visualization layouts, node and edge representations, and interactions, including strengths and weaknesses of the various approaches. We also discuss how AI and LLMs can significantly improve these analyses.