Uncharted Research
Graph Mapping: Multi-Scale Community Visualization of Massive Graph Data
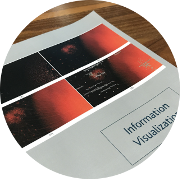
Graph visualizations increase the perception of entity relationships in a network. However, as graph size and density increases, readability rapidly diminishes. In this cover article for the July 2017 edition of the Information Visualization journal, we present an end-to-end, tile-based visual analytic approach called graph mapping that utilizes cluster computing to turn large-scale graph (node-link) data into interactive visualizations in modern web browsers.
