Uncharted Research
Financial Visualization Case Study: Correlating Financial Timeseries and Discrete Events to Support Investment Decisions
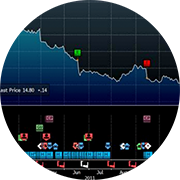
Bloomberg has designed and implemented a scalable visual representation for the depiction of many discrete timestamped events in use by hundreds of thousands of financial markets experts. This visualization enables a single screen to visually organize a large volume of event data; to facilitate inference through visual alignment of related data; and to provide a workflow from the single point of access to a wide variety of detailed information.