Uncharted Research
3Dify: Extruding Common 2D Charts with Timeseries Data
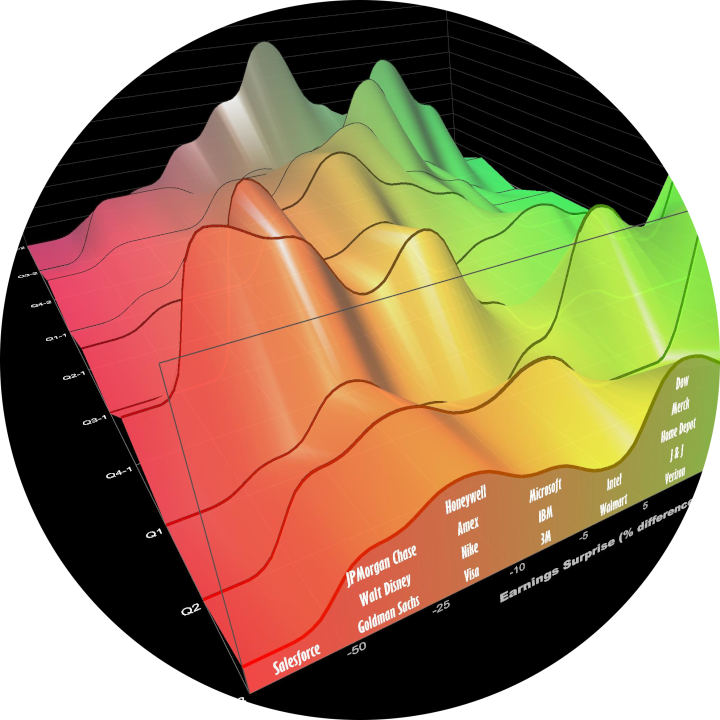
3D charts are not common in financial services. We review chart use in practice. We create 3D financial visualizations starting with 2D charts used extensively in financial services, then extend into the third dimension with timeseries data. We embed the 2D view into the 3D scene; constrain interaction and add depth cues to facilitate comprehension. Usage and extensions indicate success.