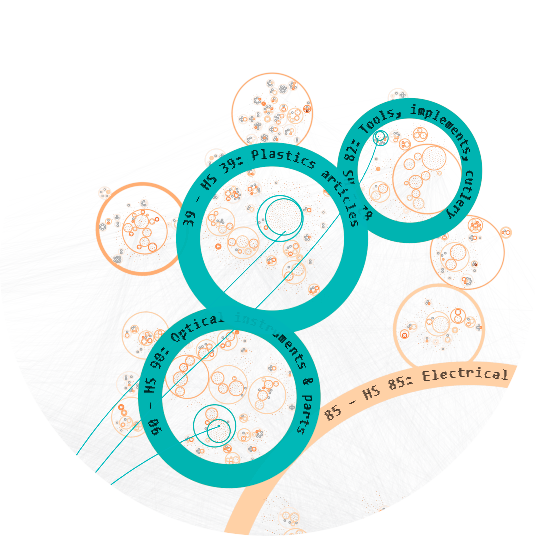
Amid escalating global trade tensions, a new embargo on a rare-earth mineral sends risk analysts into action. How do they assess a massive network with hundreds of thousands of complex relationships across industries from electric vehicles to wind turbines and defense hardware?
As part of research described in Perceptual Scalability for Systemic Risk Visual Analytics—winner of a Best Paper Award at the 30th International Conference on Information Visualisation (IV26)—we tackled this problem at real-world scale. Our interactive human-in-the-loop workflows help analysts visualize and assess networks in a way that’s fast, legible, and trustworthy.
Making massive networks analytically useful
The shape of a network can show which parts are most vulnerable. But as conventional node-link diagrams, massive networks degrade into unreadable hairballs that obscure dependencies and alternate paths around a blockage.
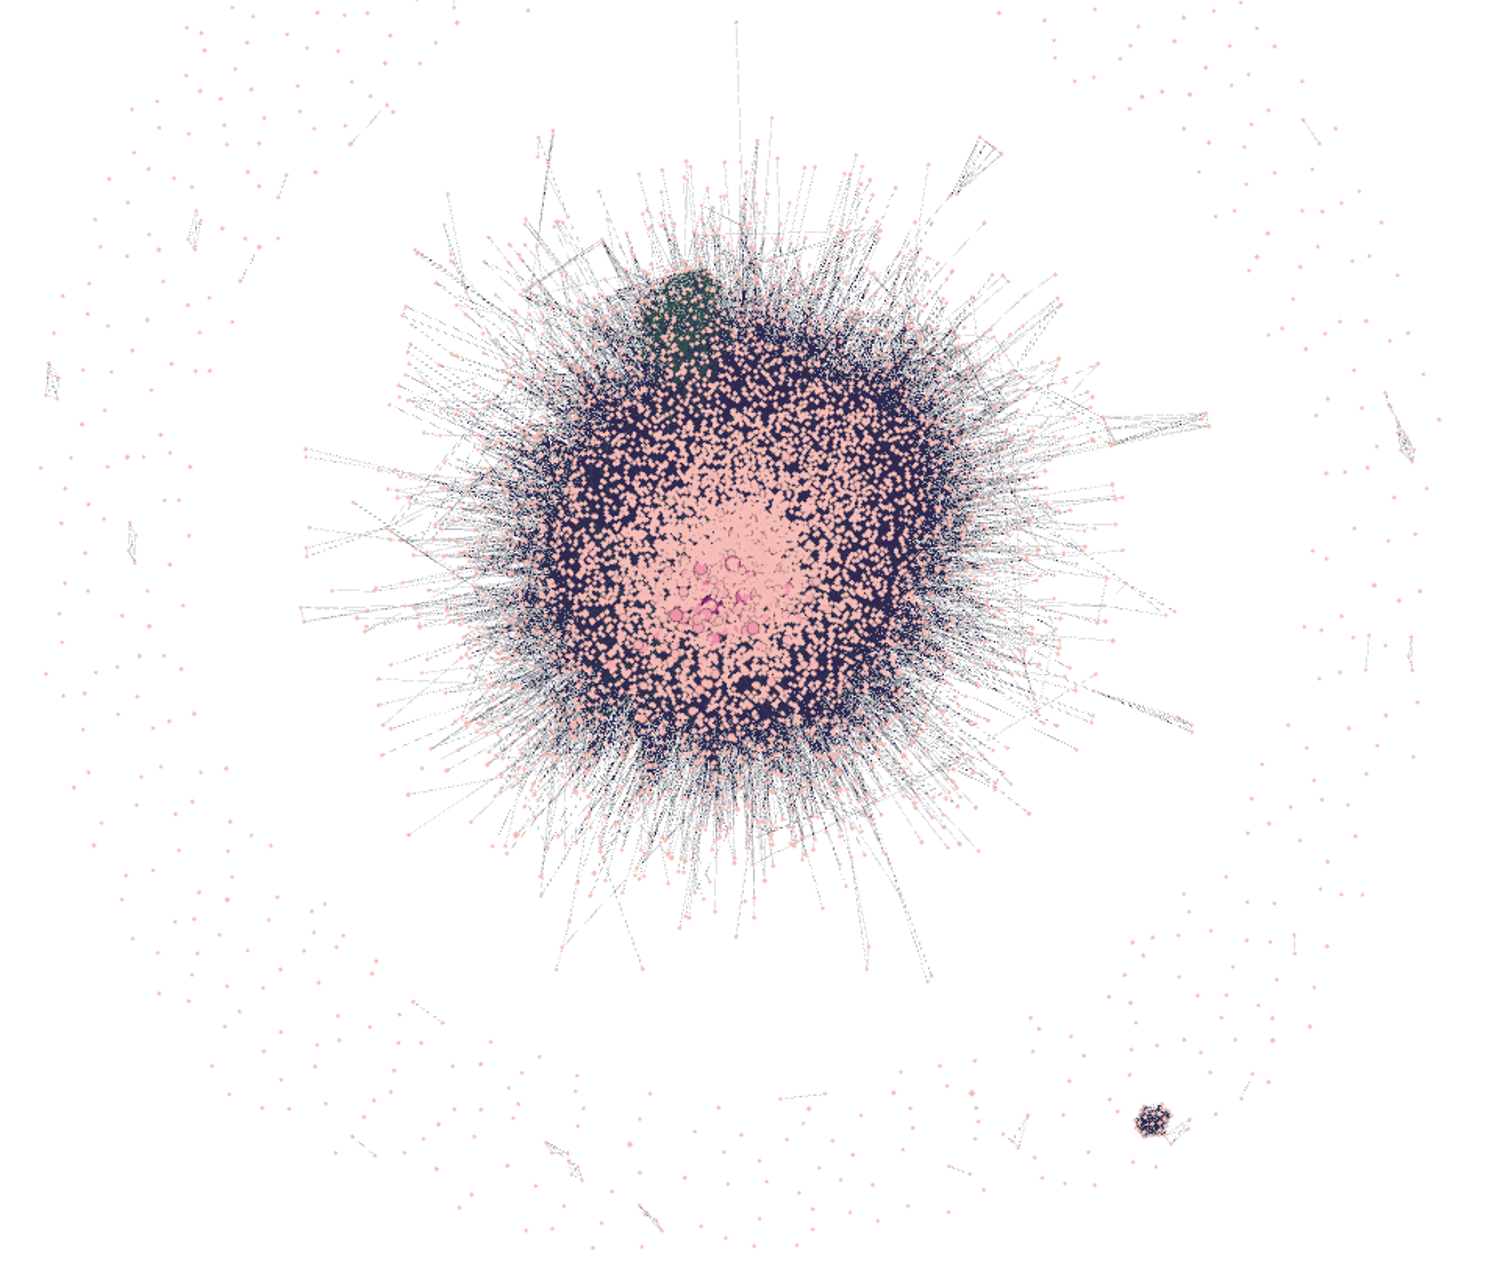
How do we help analysts tell which parts will hold and which will buckle? We designed a novel network view for perceptual scalability, the ability of a visualization to stay analytically useful as it grows. Our system combines numerous established techniques to support an interactive human-in-the-loop workflow built around how a risk analyst actually works.
The science of perceptual scalability
The many graph visualization techniques that enable perceptual scalability each address a different way that massive networks break understanding. In the example network below:
- Hierarchical grouping nests an otherwise undifferentiated mass of companies into rings organized, for example, by common industry categories. Our approach preserves lateral relationships between adjacent industries, which other common hierarchy layouts obscure.
- Force-directed clustering keeps companies and industries worth investigating together near each other. Whitespace provides structural context to relative proximity.
- Edge bundling follows the data’s hierarchy instead of its layout. Bundles remain legible at every zoom level, letting analysts jump between industry-wide flows and single-company connections instantly.
- Subgraph selection lets analysts search for, filter by, or expand out from the most relevant piece of the network. Selections are superimposed over a dimmed graph so local detail and broader context remain visible.
- Zoom-sensitive labeling provides persistent and increasingly specific landmarks—from broad categories at a distance down to individual companies—so an analyst always knows where they are.
- GPU-accelerated pan and zoom enables continuous, low-effort navigation at a scale where most graphing libraries deteriorate into a series of stalled, disorienting jumps.
Applied in isolation, none of these methods can resolve the hairball effect. Combined deliberately and grounded in the way analysts actually work, they hold the network together as it grows. This work builds on multi-scale approaches we previously developed for exploring biomedical knowledge and analyzing biological graphs.
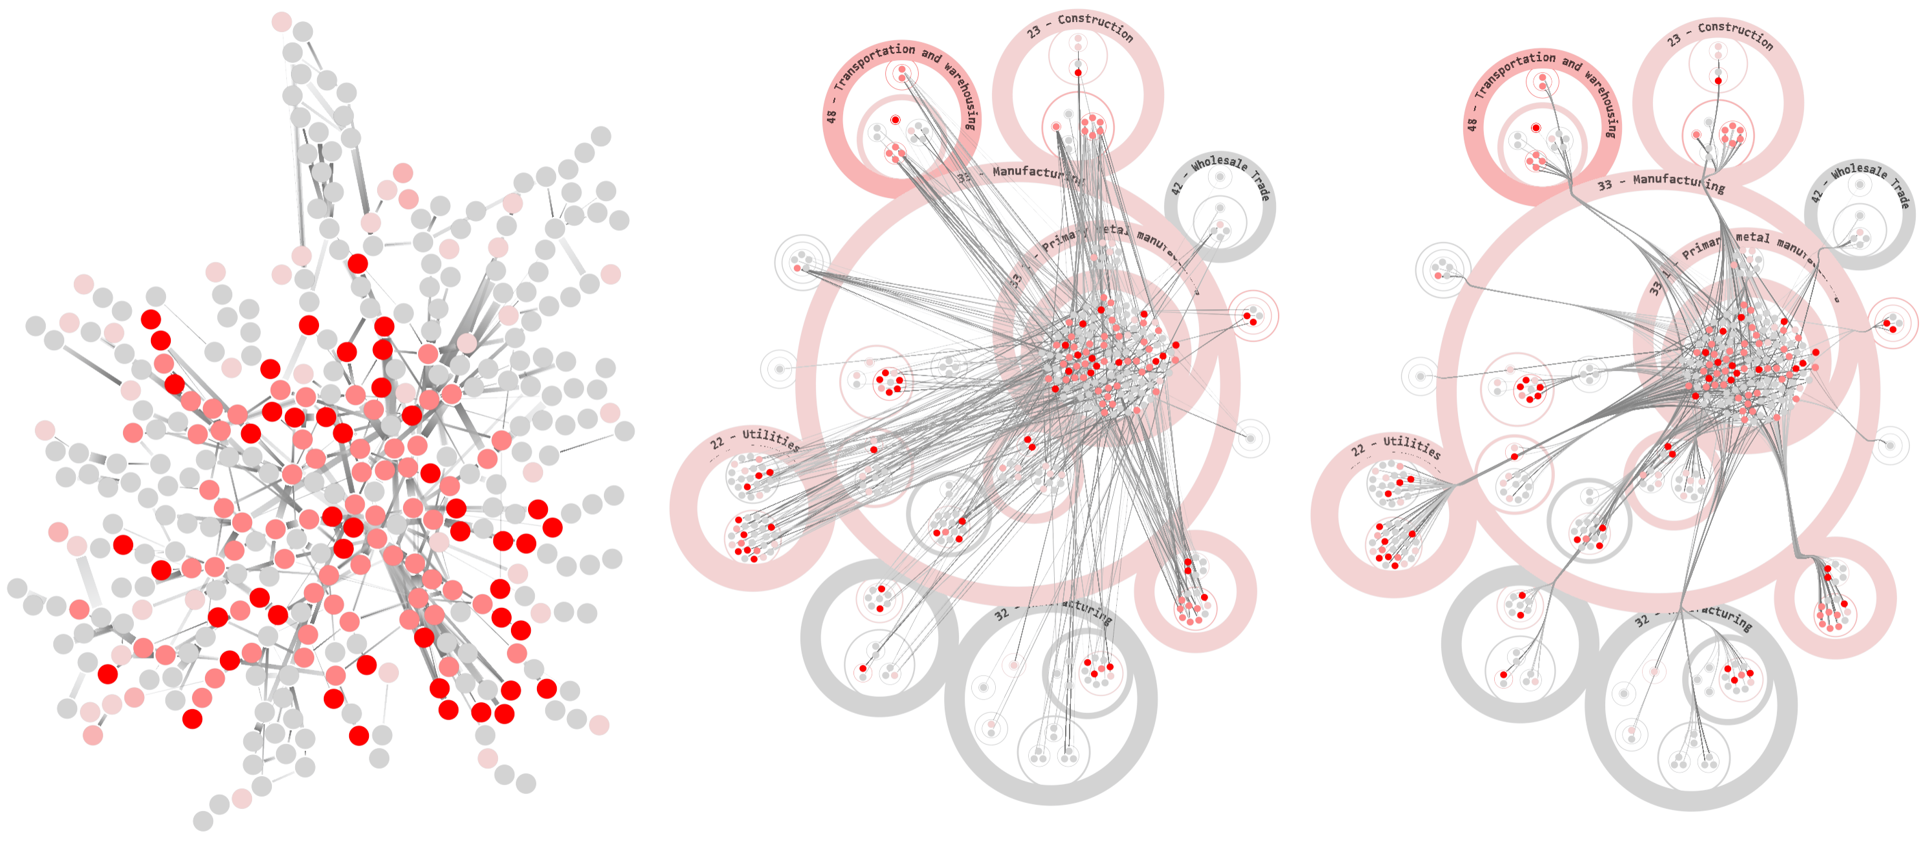
A network graph of just 300 companies (left) naturally becomes a dense hairball. Organizing the nodes into hierarchical industry rings (middle) provides structural cues to better reveal the underlying relationships. Bundling the edges by hierarchy (right) improves interpretability of dependencies and directional flow.
From research to a real analyst workflow
In the rare-earth mineral embargo scenario, an analyst can instruct the system to create a relevant industry network from billions of trade and corporate records. The resulting interactive and perceptually scalable visualization is critical to enabling downstream analysis of massive networks. In this case, our visual network becomes an entry point for the analyst to assess the embargo’s impact.
As described in our paper, case studies and user evaluations have confirmed that increased perceptual scalability enables expert analysts to perform deeper exploratory analyses of open-ended questions. Building on this foundation, we’re currently developing a production tool aimed at decision-makers who also need clear answers rather than networks to explore—where will failure spread, how severe will it be, and how quickly can the network recover?
Learn more: Perceptual Scalability for Systemic Risk Visual Analytics