As we recently discussed at the 23rd International Conference on Information Visualisation, one challenge with visualizing unstructured sources like news and social media is getting the right data. Tags and classifications for streaming text data from these sources may be prone to low-quality false positives. For example, tags intended to highlight content about “oil” may correctly identify stories about crude oil while also capturing unrelated stories about soybean oil, motor oil and the NHL’s Edmonton Oilers and missing ones about West Texas Intermediate, a common grade of crude oil.
So what happens if you don’t have much high-quality tagged data? And you can’t get generalists to add tags because the documents contain proprietary data or extensive domain-specific language? And what few (expensive) domain experts that could tag a large amount of data don’t have the time to do so? To remedy these problems, we created a subsystem to help domain experts who lack data science knowledge so they can easily build better classifiers once and only occasionally maintain them.
As outlined below, our approach uses machine learning and analytics make the process for domain experts as simple as possible.
Search terms
The analyst starts by entering the search term “crude.” The system looks for common spelling variants and applies Word2Vec to identify semantically similar words. The analyst then adds or dismisses the expanded terms (e.g. “oil,” “barrel,” “soybean” and “motor”) as needed.
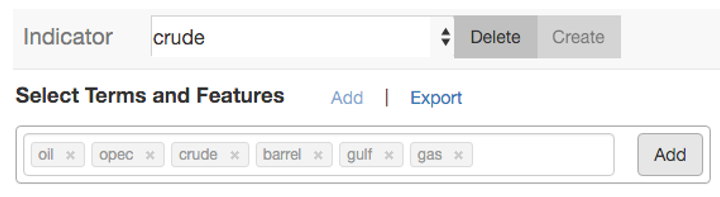
The analyst enters a classifier name (crude) and reviews related terms for relevance to the original terms. Irrelevant suggestions can be deleted.
Tagging examples
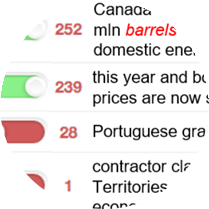
Under each search term, the analyst reviews representative articles. Some may be relevant, some not. For example, an article on “crude” could be about oil or about a celebrity’s unseemly behavior. Toggles allow the analyst to easily apply their expert judgment by accepting or rejecting articles according to relevance to the search term.

High-ranking articles that match a suggested term. Highlighted keywords show the term in context so the analyst can quickly determine relevance.
Similar documents can be shown (e.g. based on Doc2Vec) to further accept or reject borderline documents.
Classification
Based on the high-quality positive articles accepted by the analyst, the system builds a semi-supervised classifier.
Refinement
The classifier tags and visualizes a number of stories. The analyst inspects the preview visualization and flags any stories that are not relevant to the domain. This feedback informs and validates the classifier, which is then rebuilt to incorporate the new domain expertise.
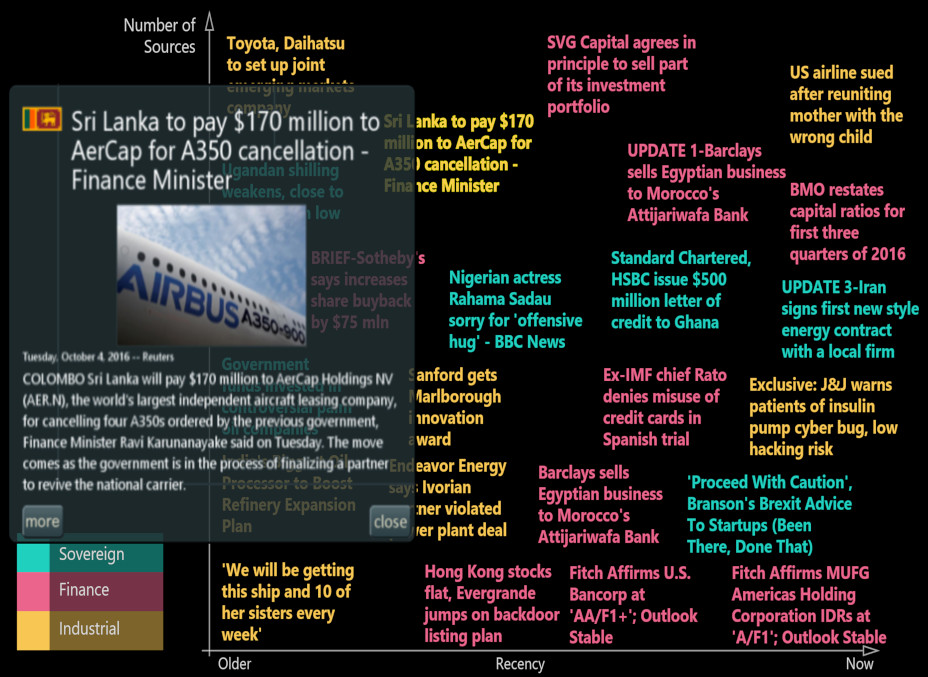
A scatterplot visualization of color-coded news headlines corresponding to each of the classifiers built by the analyst. The axes indicate recency and number of sources. Contextual previews of each article help the analyst determine the quality of the results.
Deployment
The data and visualization from the refinement step can then be deployed in the target application.
Conclusions
We tested our approach using a number of standard benchmarks and found good performance compared to other semi-supervised classification techniques. The general approach is effective for classifying unstructured data for specific application needs, such as expert users in specialized domains. There are many possible enhancements, such as improving the models for feature selection and tag recommendation or extending the functionality to modeling of relevance, tone, and interestingness.
Read More: Visual Analytic System for Subject Matter Expert Document Tagging Using Information Retrieval and Semi-Supervised Machine Learning