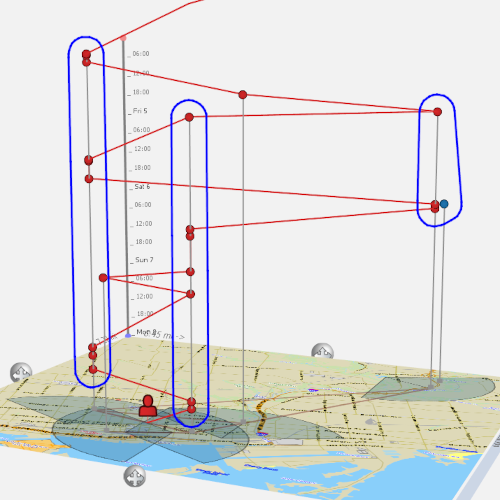
Originally developed for an advanced research project, GeoTime is a powerful tool for visualizing and analyzing events across geography and time. Uncharted cultivated GeoTime in a nascent market into a suite of enterprise-class commercial products now used at major agencies in the U.S. and around the globe. GeoTime was acquired by PenLink in 2022 and is continuing its innovative journey to reach and serve an even greater audience.
O4J
-
-
Automated Data Driven Storytelling
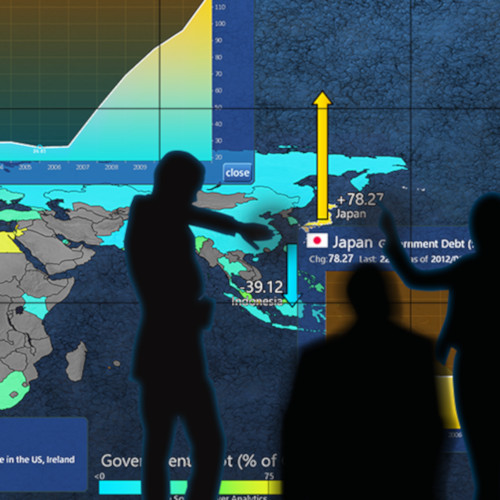
This autonomous multi-touch wall consumes news, internal research, market data and databases, and automatically generates story sequences with annotated, animated data visualizations, 24x7. In a data-driven economy, live streams are integral to every company’s brand identity, and competition for audience engagement grows daily. Here, captivating narratives portrayed on a rich, life-size canvas create a connection with passing viewers. Touching the screen with one hand or two—alone or with others—initiates a personal interaction with content of interest to explore further details.
-
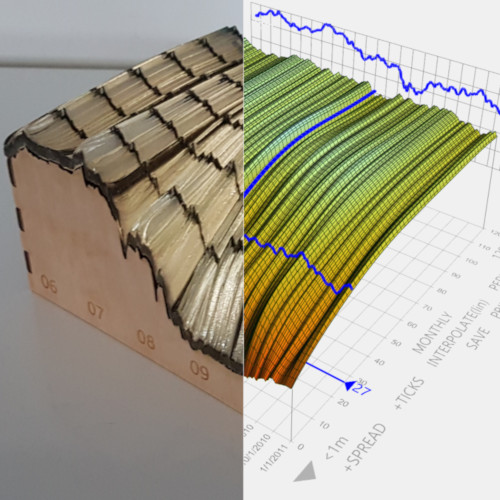
Live Trade Landscape for a Leading Exchange
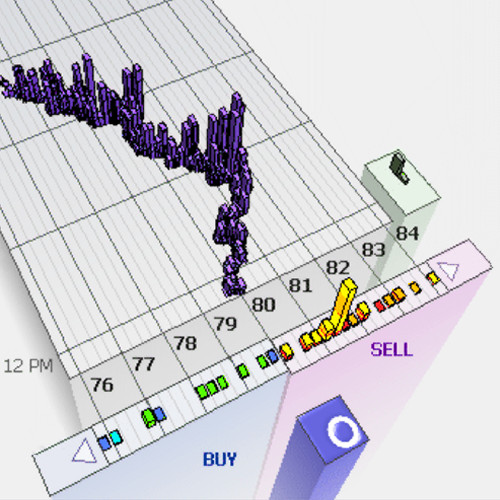
In this system designed for a leading ECN, Uncharted renders an intuitive, integrated view of supply and demand (buy and sell orders), transaction history (trades), and analytics (e.g. volume distributions and VWAP), in real time in a browser. Giving visual form to the financial market enables a trader to see developments more quickly, gaining competitive advantage. This innovative visualization design earns praise in David Leinweber’s book Nerds on Wall Street.
-
Navigating Conflict with MobileTerrain
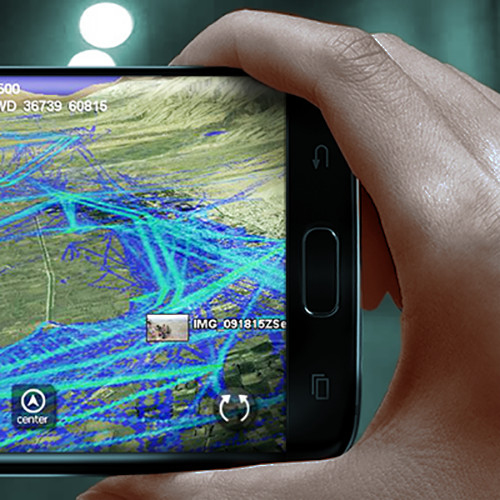
MobileTerrain™ is a next generation C2ISR solution for mission-critical data collaboration in real time. Cross-platform (Windows/Android/Linux) and designed for desktop, vehicle, tablet and dismounted handheld operation, MobileTerrain provides one solution for all tactical information where low bandwidth and disconnected operability are needed across the battlespace.
“Geo-chat,” C2 messaging, planning tools, vehicle integration, camera feeds and more are built-in and easy to use with little training required. MobileTerrain’s extensible, componentized SDK enables rapid development and integration of new capabilities.
-
Mission Critical Awareness, Planning and Execution
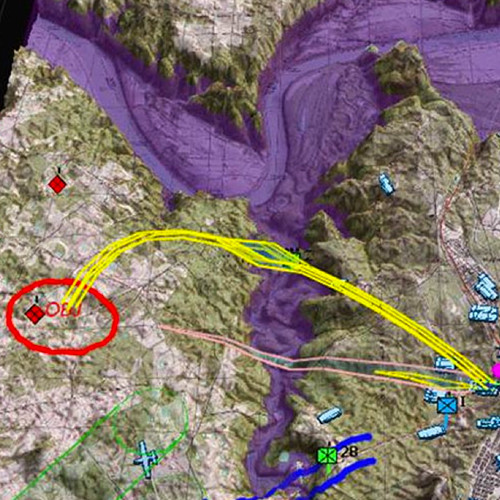
Real-time visualization provides commanders with the necessary tools for rapid assessment and comprehension of highly complex situations. Staying inside the opposition’s awareness / planning / decision cycle is essential when the ultimate goal is concurrent planning and execution. Interactive visual collaboration enables participants to work together remotely with shared understanding to plan next steps more rapidly and successfully. Uncharted develops and supports C2 collaboration solutions that are deployed and used around the world every day.
-
Airspace Management - Extreme Real-Time Performance
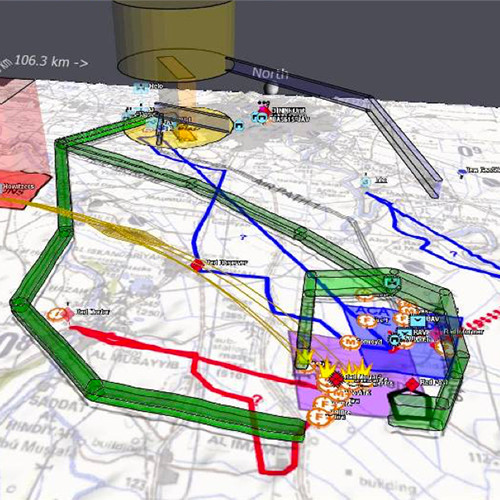
Uncharted provides interactive 2D and 3D visualization of complex airspace control measures, planned and actual mission routing, objectives and alert analytics that meets real-world performance and throughput requirements. Independent evaluations prove that Uncharted outperforms other legacy and incumbent solutions in terms of display, usability and cognitive performance.
-
"What If" Global Risk Forecast for BHP Billiton
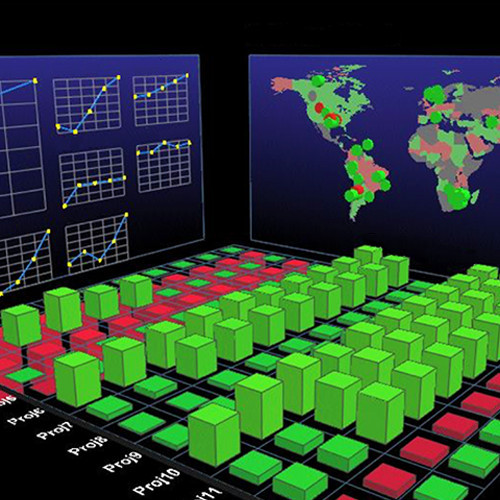
This tool for senior and executive management won Energy Risk magazine’s prestigious “Innovation of the Year.” Asset class by term structure is shown on the floor, while one wall provides a geographic roll-up and the other shows financial metrics. BHP Billiton, one of the world’s largest resources companies, uses a diversified portfolio strategy to manage assets. Uncharted’s enterprise risk visualizations create and assess what-if scenarios such as potential acquisitions and their impact on short-term risk.
You can’t access and analyze all the variants unless you use a simulation tool like this. - CEO
-
Improved Portfolio Monitoring, Analysis and Communication
Managing a portfolio presents endless opportunities for improved success, from deep analysis of underlying markets, creating predictive models, combining a wide variety of data sources, monitoring securities in real time, to communicating with multiple stakeholders. In our over 25 years of experience in the field, interactive visual analysis of structured financial products has proven to better reveal real-time market opportunities, flag historic anomalies, facilitate interactive what-if risk analysis and engage clients with insights.