GeoTime makes for a fantastic way to visualize animal migration data. Seeing patterns and observing anomalies in animal tracks over time is the sort of problem perfectly suited for Geotime’s 3D space-time viewer. However when trying to load several years worth of data, one quickly runs into GeoTime’s soft performance cap of a few hundred thousand points of data.
For this year’s hackathon we set out to break through that soft limit in GeoTime, and load just shy of 1.2 million individual points of data into GeoTime for analysis. To do this we set out with two courses of action: identify hotspots in our existing code, and replace our in-memory model with a database.
Through profiling we were able to identify a few key features in GeoTime that were very expensive. In order to make our tight hackathon deadline, we simply removed these features. This, in addition to some basic rendering tweaks, was all it took for us to hit the 1.2 million event mark.
Our database endeavors however, were not quite as successful. Using an H2 database, we managed to replace much of GeoTime’s in memory data model just within the hackathon deadline. However, every single interaction with that data model in GeoTime was not written in a database friendly way. This meant that we actually lost performance. With just a bit more time we could have had GeoTime playing nicely with a database back end. With the other changes made in GeoTime, this would have let us load into the millions.
There is still a fair amount of work to do in applying the findings we made during the hackathon to future versions of Geotime. Simply deleting code doesn’t work for the real world, as that code represents current features, and users don’t always have the luxury of working with clean, simple data like we had in our 1.2 million events. With that being said, we look forward to taking the things that we’ve learned here and finding ways of applying them to future GeoTime release in an effort to scale up our data.
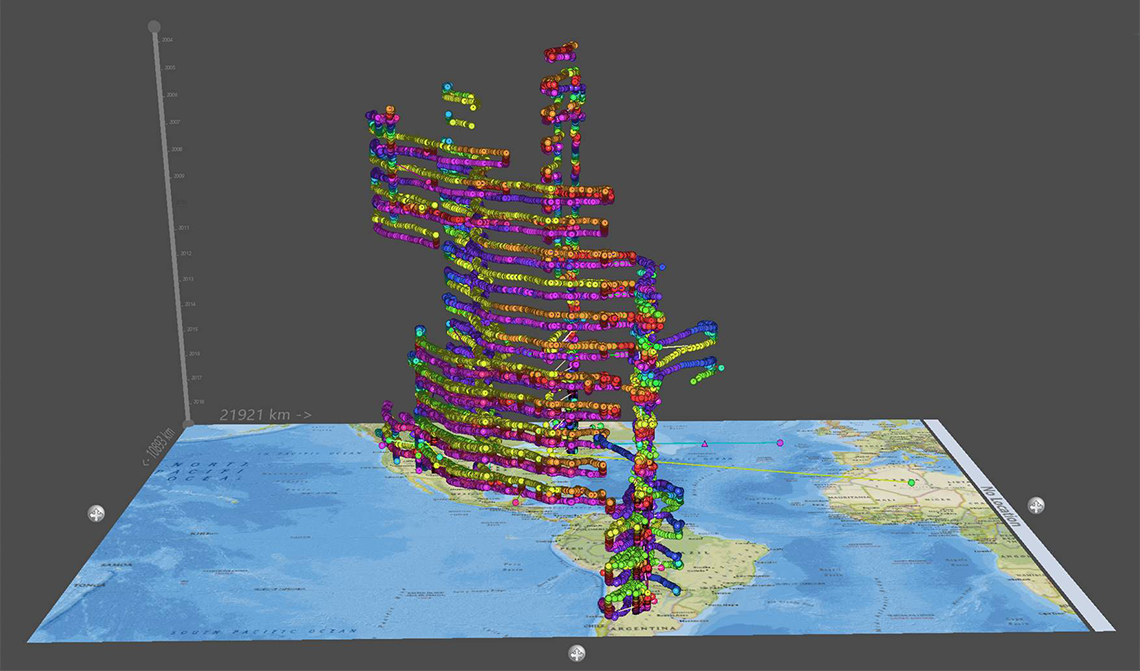
Visualizing 15 years of turkey vulture migration patterns in GeoTime.
Data from:
Dodge S, Bohrer G, Bildstein K, Davidson SC, Weinzierl R, Mechard MJ, Barber D, Kays R, Brandes D, Han J (2014) Environmental drivers of variability in the movement ecology of turkey vultures (Cathartes aura) in North and South America. Philosophical Transactions of the Royal Society B 20130195. doi:10.1098/rstb.2013.0195
Bildstein K, Barber D, Bechard MJ (2014) Data from: Environmental drivers of variability in the movement ecology of turkey vultures (Cathartes aura) in North and South America. Movebank Data Repository. doi:10.5441/001/1.46ft1k05